

INTRODUCTION
October 2019: Updated to latest available data, and some improvement in the selection of transition events and periods.
This post shows a monthly average minimum (Tmin) temperature reconstruction back to 1872 for a rural region of South East Australia that contains the towns of Rutherglen, Kerang, Deniliquin and Wagga Wagga. The following map shows the area used to form a regional average, and most of the weather stations used:

Map sources: Google, and BoM Climate Data Online (CDO)
In addition, a few more distant station records were examined/used as follows:
- Melbourne Regional Office data was used to contribute to the regional average weather fluctuations (but not to the regional moving averages, due to anomalous warming), helping the procedure to operate through a period around 1878 when much data is either missing or poor.
- Hay Miller Street data was used between 1881/08 and 1899/12 due to sparsity of local data in that early period, it was found to be reasonably consistent with Rutherglen-region temperature variations, and to be free of any obvious inhomogeneities in that period.
- Forbes data was examined but not used, as it was found to be insufficiently consistent with that in the Rutherglen area.
Temperature Data Sources: All temperature data (monthly average Tmin) was downloaded from BoM CDO (see the Data page for link) in October 2019. It is not necessary to deal with version numbers of the data, as it is all raw data, and the BoM does not alter its raw data. The full list of stations used is given at the end of this post.
Metadata Sources: Ashcroft 2014, Torok 1997, and the ACORN-SAT 2018 Station Catalogue (see the Data page for links)
Methodology: The standard methodology of this website was used, see the pages above, starting with OUTLINE. Many step changes in temperature were detected visually from scratch, or confirmed visually against metadata. Some periods of more complex anomalous temperature change were detected, in particular the period from 1966 to 1986 at Rutherglen Research, and from 1928 to 1950 at Wagga Wagga Kooringal. The large amount of data in this region at those times allowed these complex periods to be simply ignored, by marking them as extended transitions.
RESULTS
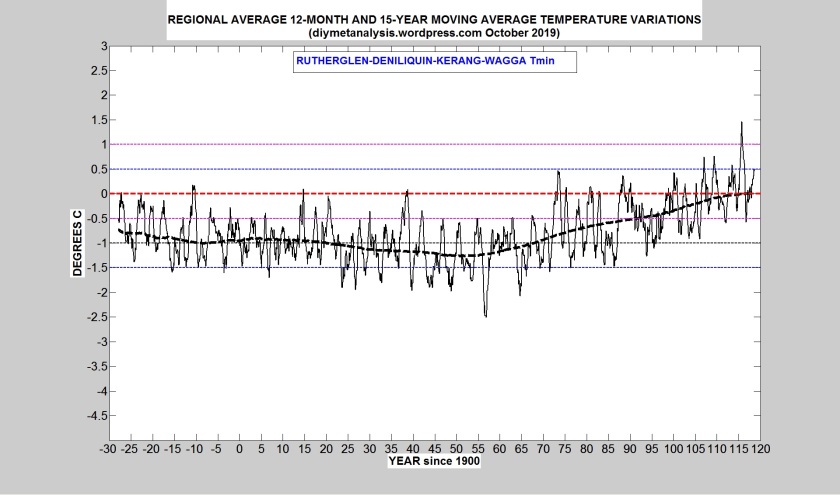
The following figure shows the 12-month moving average of regional-average Tmin variations, together with its 15-year moving average:
The seasonal dependence of the Tmin variations is shown in the following figure:

Finally, the Tmin variations for each separate month are shown in the following two figures:


VALIDATION
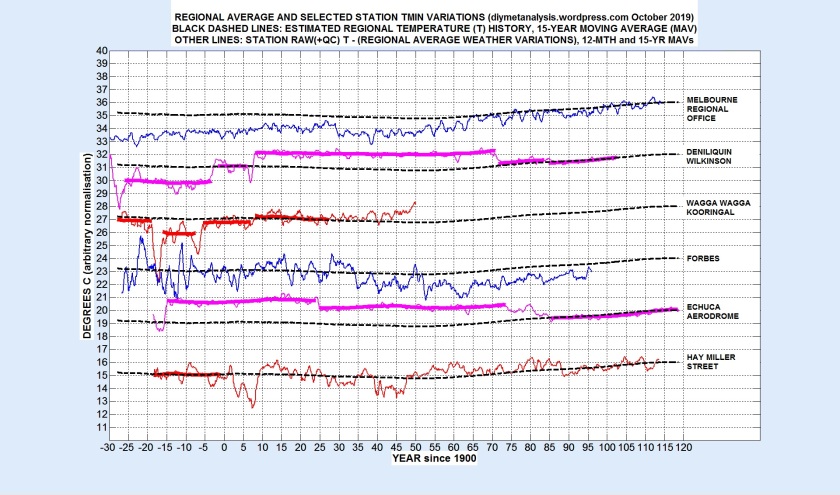
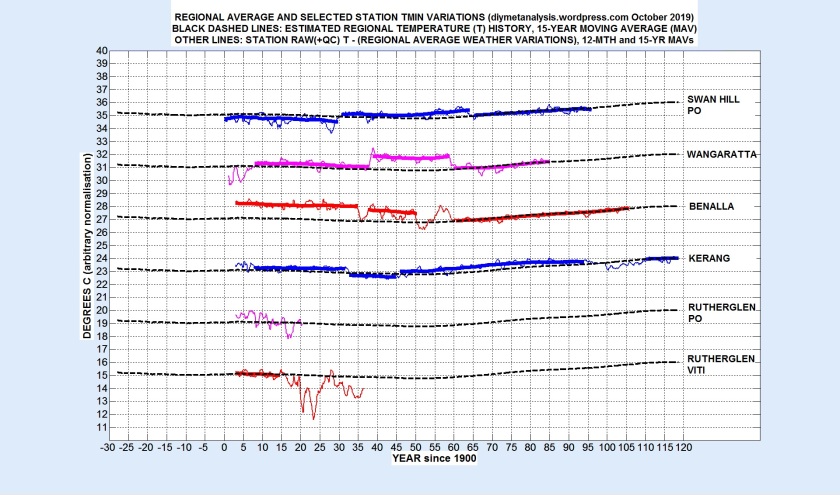
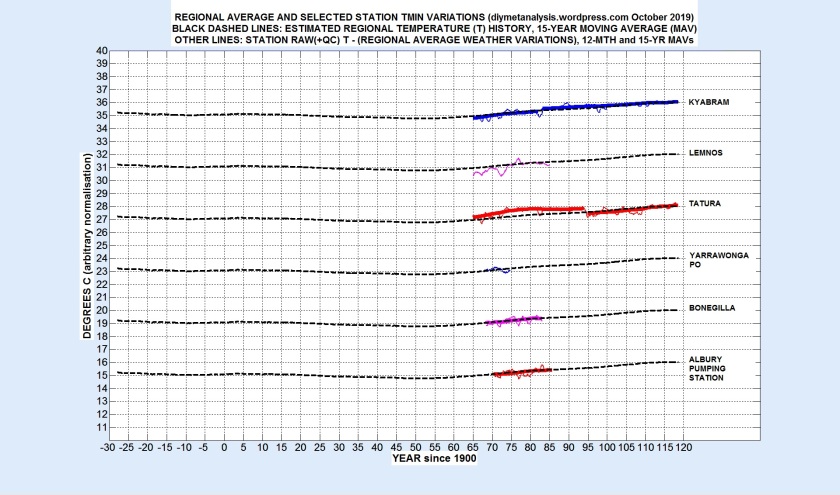
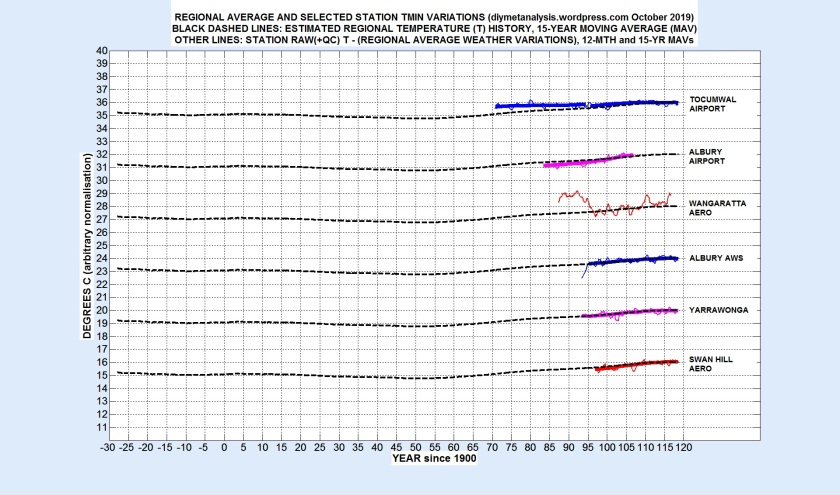
The following set of figures show 12-month and 15-year moving averages of “regional-weather-corrected” Tmin data for 42 of the 44 stations examined, in order of increasing start date.
The bold lines are the station regional-weather-corrected moving averages used to obtain the regional moving average, shown as the dashed black lines. Validation follows from the identification and clean exclusion of periods of anomalous temperature change.


SAMPLE STATION ANALYSIS
Each station record is compared visually against the others, and against the latest estimate of the regional average temperature history. The following figures show some of the analysis plots for the example of BEECHWORTH COMPOSITE, which has very clear step changes in temperature, presumably corresponding to the dates when the separate station records were concatenated to form the composite record:

The step changes are obvious, and the upper data (relative to the regional average) suggests (but does not fully establish) the desirable result that the station temperatures tracked the regional average relatively consistently. It is also necessary to check the separate monthly data, to ensure that there are no opposing seasonal trends, and to estimate the dates of the step changes:

The figure above shows monthly data for May to December, and on it is marked the date estimated for the step change in 1924. Note that 1924 data prior to August are “high”, and that data after is “low”. In this case, with such large steps, there is little doubt about the dates, but in general there is some uncertainty.
STATION DATA
The following figure shows the “nominal” number of stations being averaged in each year of the reconstruction, the actual number of stations present in the average is a bit lower because some periods of data are excluded.

The list of stations used, together with the periods excluded, is given in alphabetical order in the following list, copied and pasted from the configuration file for the region.
NOTES
- TR = transition, the name given to all periods excluded from regional averaging
- W = 1 means this station record was included in regional averaging of weather fluctuations (slow transitions, such as gradual urban heating, or shading from growing vegetation, might be included in weather averaging, but excluded from averaging of station moving averages)
- M = 1 means this station was included in the regional moving average
- Transition Flag = 1 means that this transition period was excluded from regional averaging of weather fluctuations
- The other transition parameters are the start year/month then the end year/month
- QC NaNs are data deemed to be invalid, the software sets them to NaN (Not a Number), which triggers their automatic infilling using valid data either side and the latest estimate of the regional average weather variations
- SS = Stevenson Screen, MNT = Minimum Thermometer
*****************************************************
N_half = 7; % Moving average window size = 2*N_half + 1
stations = […
%BoMid W M From Norm To (W/M are Weather/Moving-average flags, see NOTES)
01 72000 1 1 1907 1994 1994;… % ADELONG PO
%QC NaNs: 1913/10:1916/9,1921/10:1922/3,1937/12,1939/1:3,1948/1,…
% 1952/4&5, 1969/12, 1970/6:9, 1970/11
% TR: 1908 10 1908 10 % UNK
% TR: 1924 05 1924 05 % UNK
% TR: 1940 03 1940 03 % UNK
% TR: 1950 01 1950 01 % MOVE (TOROK)
02 72160 1 1 1993 2019 2019;… % ALBURY AWS (no QC or TR)
03 72097 1 1 1970 1986 1986;… % ALBURY PUMPING STATION (no QC or TR)
04 72146 1 1 1983 2007 2007;… % ALBURY AIRPORT (no QC or TR)
05 82001 1 1 1908 1986 1986;… % BEECHWORTH COMPOSITE
% QC NaNs: 1949/09:1950/03
% TR: 1912 04 1912 04 % UNK
% TR: 1924 08 1924 08 % UNK
% TR: 1976 01 1976 01 % UNK, BUT TOROK SAYS MOVE IN 1977/06
06 82170 1 1 2006 2019 2019;… % BENALLA AIRPORT (no QC or TR)
07 82002 1 1 1903 2006 2006;… % BENALLA
% QC NaNs: 1911/05:10, 1915/07:08, 1919/09:10, 1946/09:1947/04
% TR: 1935 12 1937 07 % UNK (NO MENTION IN TOROK)
% TR: 1951 06 1960 06 % POOR DATA PERIOD BETWEEN MOVES
08 74009 1 1 1907 1940 1975;… % BERRIGAN PO
% QC NaNs: 1928/01, 1928/09:11, 1929/09:10
% TR: 1916 01 1920 12 % POOR DATA
% TR: 1941 01 1956 12 % POOR DATA
% TR: 1965 01 1975 01 % POOR DATA
09 82100 1 1 1968 1983 1983;… % BONEGILLA (no QC or TR)
10 80002 1 1 1907 1980 1986;… % BOORT
% QC Nans: 1940/11:1941/02, 1956/02
% TR: 1981 01 1986 12 % POOR DATA
11 74034 1 1 1907 2019 2019;… % COROWA AIRPORT
% QC Nans: 1907/01:08, 1908/08, 1910/04:95, 1912/04:09, 1915/06:10, …
% 1919/05&09, 1920/05, 1921/09, 1924/11, 1925/11, 1926/11, 1926/01&02, …
% 1926/05&06, 1927/03, 1929/10, 1974/06->11, 1975/07->10, 1976/01, …
% 1980/03->12, 2003/11->12
% TR: 1948 08 1956 12 % MOVE 1948/08 (TOROK)
% TR: 1978 08 1978 08 % MOVE (TOROK)
12 74039 1 1 1947 1973 1977;… % DENIL FALKINER (no QC)
% TR: 1973 10 1977 11 % UNK
13 74258 1 1 1997 2019 2019;… % DENILIQUIN AWS (no TR)
14 74128 1 1 1867 2003 2003;… % DENILIQUIN WILKINSON
% QC NaNs: 1878/10->12, 1919/01->06
% TR: 1871 04 1873 12 % MNT CHANGE 1871/04 (ASHCROFT), EXTENDED TO 1873/12
% TR: 1897 09 1898 05 % VISUAL STEP 1897/09 THEN SS 1898/05 (ASHCROFT)
% TR: 1907 02 1908 01 % UNK
% TR: 1971 09 1971 09 % MOVE (TOROK)
% TR: 1984 09 1984 09 % MOVE (TOROK)
15 80015 1 1 1881 2019 2019;… % ECHUCA AERODROME
% QC NaNs:
%1888/5:8,1889/5:8,1892/8,1897/9:12,1898/10:12,1899/9:1900/7,1907/9
% TR: 1885 02 1885 02 % UNK
% TR: 1925 01 1925 01 % UNK
% TR: 1974 06 1985 04 % ANOMALOUS PERIOD BETWEEN MOVES (TOROK)
16 82016 1 1 1909 1955 1976;… % EUROA
%QC NaNs: 1934/01&12, 1941/04, 1953/06
% TR: 1909 01 1926 04 % POOR DATA
% TR: 1965 01 1976 02 % UNK
17 65016 0 0 1873 1926 1998;… % FORBES (NOT USED)
18 75031 1 1 1881 1900 2014;… % HAY MILLER STREET
% QC NaNs: 1881/01:07, 1883/11:1884/04, 1889/10:1889/12
% TR: 1900 01 2014 12 % UNK
19 72023 1 1 1922 2019 2019;… % HUME RESERVOIR
% TR: 1920 01 1956 12 % POOR DATA
% TR: 1965 01 1975 01 % POOR DATA
20 80023 1 1 1903 2019 2019;… % KERANG
%QC NaNs: 1918/03&09,1918/09,1928/01,1931/4,1932/4&11,1933/4&11,1937/6:7
% TR: 1903 01 1907 12 UNK (but TOROK has MOVE in 1907/02)
% TR: 1932 08 1932 08 % MOVE (TOROK)
% TR: 1945 11 1945 11 % SCREEN REORIENTATED (TOROK)
% TR: 1995 01 2010 01 % UNK (MOVE IN 2000 – ACORN-SAT CATALOGUE)
21 80091 1 1 1965 2019 2019;… % KYABRAM
%QC NaNs: 1991/05, 1999/08:09
% TR: 1983 01 1983 01 % UNK
22 81084 0 0 1965 1985 1985;… % LEMNOS (not used)
23 74069 1 1 1949 1969 1969;… % MATHOURA STATE FOREST (no QC or TR)
24 86071 1 0 1855 2015 2015;… % MELBOURNE REGIONAL (NOT USED FOR MAVR)
25 82034 0 0 1927 1956 1956;… % MYRTLEFORD PO (not used)
26 80043 0 0 1908 1977 1977;… % NUMURKAH PO (not used)
27 80049 1 1 1940 1975 1975;… % ROCHESTER (no TR)
28 82039 1 1 1912 2019 2019;… % RUTHERGLEN RESEARCH
% QC NaNs: 1920/03:11, 1925/02:10, 1967/11:12
% TR: 1914 01 1914 01 % MOVE (TOROK)
% TR: 1967 01 1983 09 % UNK
% TR: 2012 05 2012 05 % UNK
29 82038 0 0 1903 1921 1921;… % RUTHERGLEN PO (not used)
30 82085 1 1 1903 1915 1936;… % RUTHERGLEN VITI (no QC)
% TR: 1915 08 1936 12 % POOR DATA
31 77094 1 1 1996 2019 2019;… % SWAN HILL AERO (no TR)
32 77042 1 1 1899 1996 1996;… % SWAN HILL PO
% QC NaNs: 1907/10, 1938/03, 1960/12, 1967/08, 1967/11:1968/01
% TR: 1930 11 1930 11 % MOVE 1930/11 (TOROK)
% TR: 1965 04 1965 04 % UNK
33 81049 1 1 1965 2019 2019;… % TATURA
% TR: 1994 11 1994 11 % UNK
34 74106 1 1 1970 2019 2019;… % TOCUMWAL AIRPORT
% TR: 1995 07 1995 07 % UNK
35 74110 1 1 1914 1956 1975;… % URANA PO
%QC NaNs: 1933/09:12, 1934/01:04, 1949/01
% TR: 1914 01 1926 07 % POOR DATA
% TR: 1965 01 1975 12 % UNK
36 72150 1 1 1942 2019 2019;… % WAGGA WAGGA AMO
% TR: 1941 01 1949 12 % ANOMALOUS COOLING PERIOD
% TR: 1969 08 1969 08 % UNK (POSSIBLY RELATED TO GRAIN SILO, ACORN CAT)
37 72151 1 1 1871 1928 1950;… % WAGGA WAGGA KOORINGAL
%QC NaNs:1872/01,1873/12,1874/01&10,1875/03,1887/09:1889/02,1917/10:1918/07
% TR: 1882 02 1883 12 % UNK
% TR: 1893 08 1894 06 % MNT CHANGE 1894/06 (ASHCROFT)
% TR: 1908 01 1908 01 % UNK
% TR: 1928 04 1950 12 % ANOM WARMING, starts at 1928/04 move (TOROK)
38 73127 1 1 1913 1975 1975;… % WAGGA WAGGA AG
%QC NaNs: 1950/07, 1955/09:10, 1965/02:03
% TR: 1913 01 1932 02 % UNK
39 75080 1 1 1914 1927 1927;… % WANGANELLA (no QC or TR)
40 82138 0 0 1987 2008 2008;… % WANGARATTA AERO (not used)
41 82053 1 1 1901 1987 1987;… % WANGARATTA
%QC NaNs: 1902/04:05, 1902/12
% TR: 1900 01 1907 12 % UNK
% TR: 1938 10 1938 10 % MOVE TO PO (TOROK)
% TR: 1959 12 1959 12 % UNK (POSSIBLY MOVE, TOROK)
42 82056 1 1 1954 1968 1968;… % WODONGA (no QC or TR)
43 81124 1 1 1993 2019 2019;… % YARRAWONGA (no QC or TR)
44 81057 1 0 1965 1975 1975;… % YARRAWONGA PO (not used for MAVR)
%QC NaNs: 1965/01:1967/09
END OF POST

One thought on “Example 01: RUTHERGLEN Tmin”