

Map above: The location of the ACORN-SAT stations, from the Australian BoM
SCOPE
This page contains background information and summaries of validation test results for ACORN-SATv2.2 (version 2.2). There is no intention to cherry-pick bad errors, but they are given prominence to illustrate how the error-prone ACORN-SAT adjustment procedure does indeed lead to errors, which accumulate as in a random walk, going backwards in time from the present. The errors appear to be biased towards excessive cooling of early data.
The policy is to show ALL results that are obtained.
Berkeley Earth (BEST) data is used as a convenient source of “reference series” for the validation tests. See the BEST page above for some information on the use of BEST data for this purpose.
ACORN-SAT data and documentation is available from: http://www.bom.gov.au/climate/data/acorn-sat/
The online station catalogue, including adjustment information is available from (for Adelaide, select other stations via the tab on the right hand side of the page):
http://www.bom.gov.au/climate/data/acorn-sat/stations/#/23000
The latest scientific publication for ACORN-SAT (Trewin et al, “An updated long-term homogenized daily temperature data set for Australia”, 2020) is available from:
https://rmets.onlinelibrary.wiley.com/doi/10.1002/gdj3.95
OUTLINE OF ACORN-SAT
ACORN-SAT is a homogenised daily temperature data product, with separate data for Tmax and Tmin, that has undergone a procedure that detects/confirms inhomogeneities and adjusts raw data so as to eliminate them, with merger to create long composite records. A “rectangular” model of non-climatic influences is assumed, and the example of minimum temperatures at Deniliquin (in Southern NSW) shows that this model is a good one at least in some cases:

The blue data in the figure above indicates the adjustments made to the raw data in red, with positive values meaning that temperatures are reduced. The substantial cooling adjustments of early raw data, especially in this region of Australia, led to unfounded suspicions of “data tampering”, but there are many examples of invalid adjustments, the overall effect of which is (probably) to “somewhat” overestimate 20th century warming.
It will be seen in many cases that the rectangular model of non-climatic influences is a poor approximation, and that errors have also been made in merging records to form composites, with too much faith placed in short periods of overlap, ignoring evidence from neighbouring stations. The example shown below of maximum temperatures at Alice Springs has the worst errors found so far:
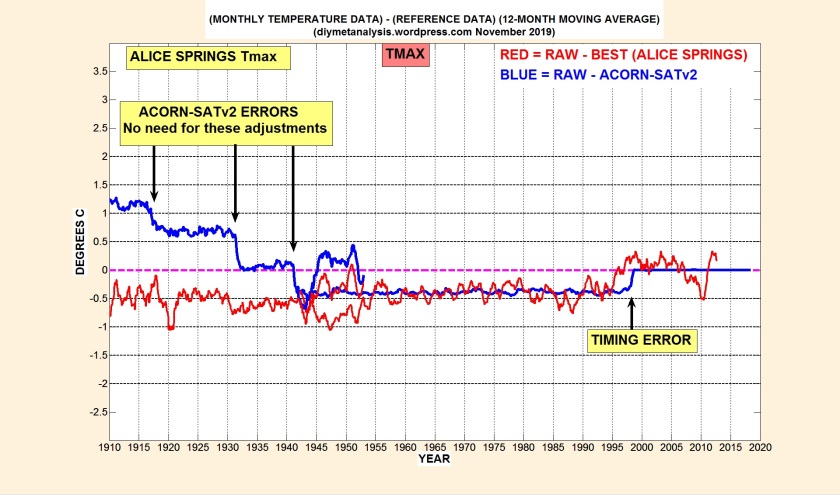
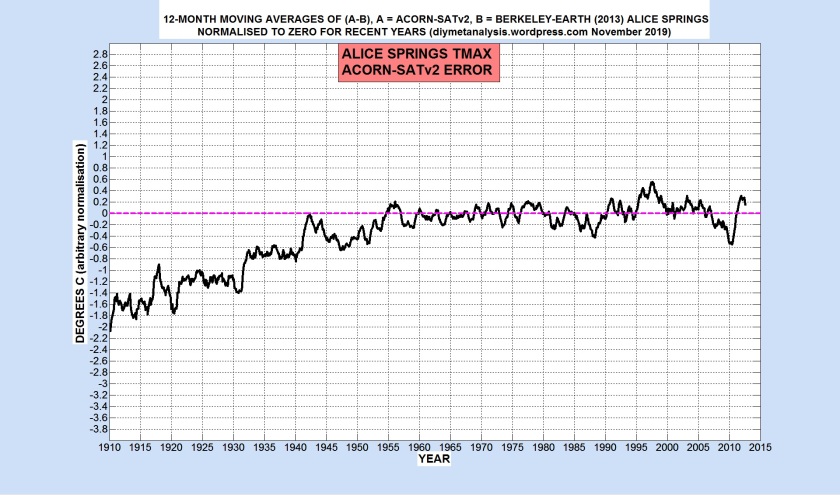
The errors shown above lead to very excessive and invalid cooling of early data:
Other major ACORN-SATv2 errors found so far are as follows:
- Post ACORN-SATv2 TEST01: RUTHERGLEN, WAGGA WAGGA and KERANG Tmin
- Post ACORN-SATv2 TEST02: SNOWTOWN Tmax
- Post ACORN-SATv2 TEST04: HORN ISLAND Tmin
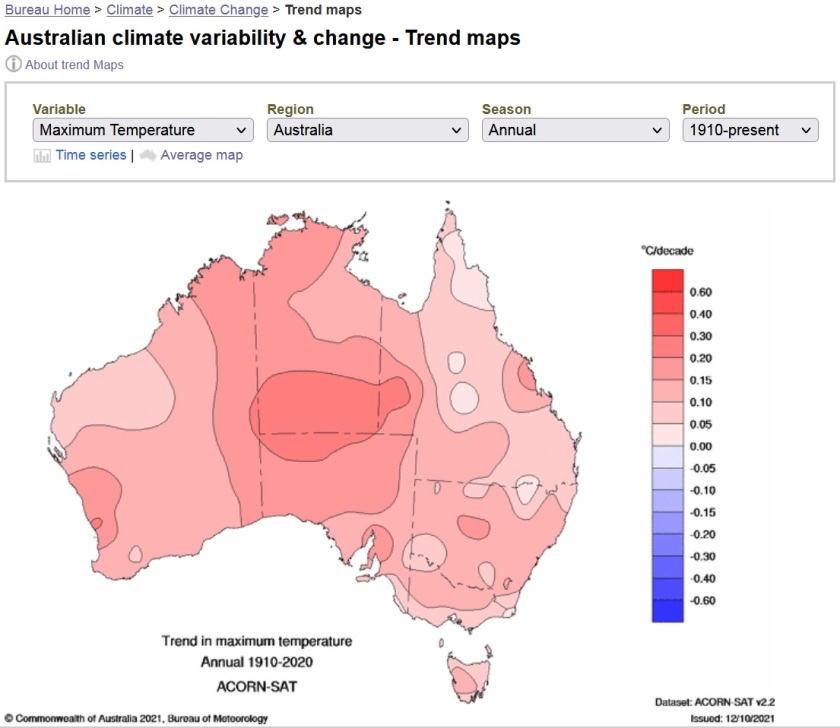
TREND MAPS
The BoM uses ACORN-SAT data to generate trend maps for Australia, intended to show how seasonal and annual trends for Tmax and Tmin vary across the country. There is little doubt that these trend maps are primarily indicating the stations with worst errors, which appear as hot and cold spots centred on those stations:

DATES OF STATISTICAL ADJUSTMENTS
Many adjustments made in ACORN-SAT are detected in the data, with no known reason for their existence, and they are known as “statistical”. The following figure shows a bar chart of the dates of the statistical adjustments across the entire database, covering both Tmax and Tmin:

Some of the spikes in the figure above are understandable, in particular the ones at the start/end of WW1/2, but the 21st century ones are somewhat mysterious and of dubious validity, given the special status of these climate monitoring stations.
CSV File Reading
I firstly open each CSV file of interest with Notepad, and create another file without the header lines, and with the first and last months having lines for all days of the month. Often the first month of data is missing a line for the first day of the month, and sometimes this also applies to the last day of the last month, I manually insert lines with no temperature data to make life easier for the software.
I use the following MATLAB as the core of the file reading software, it sets missing temperatures to NaN (not-a-number):
[dates, temps, notused] = …
textread(strcat(Folder,File),’%s %f %f’, ‘delimiter’, ‘,’, ’emptyvalue’, NaN);
At least 4 of the CSV files have missing lines of data as follows:
- tmax.010092.daily.csv is missing 2017 1st to 4th January
- tmin.010092.daily.csv is missing 2017 1st to 17th January
- Burketown tmax and tmin are missing 2017 1st to 24th January
My file reading software prints the “dates” entry (the first column of data) for what it thinks is the first day of each year, and for the first day of each month of the last year, this helps to avoid errors, and to pinpoint any that do occur.
Monthly Average File Creation
The data for each month is read from the linear array of all temperatures (the “temps” array in the MATLAB above), taking account of the rules for leap years. An average for a month is created if it contains fewer than 7 days with missing data, otherwise it is set to NaN.
Text files are created for the monthly averages, with the annual average in the last column. These files, and/or the associated MATLAB software, are available on request.
Automatic Infilling
Missing months of data are usually infilled automatically when a suitable “reference series” exists when the data is read by an application. The infilling operates purely on the basis of the valid data present in the same month, before and after any missing datum. There is a maximum gap parameter, usually set to 3 years, gaps longer than that are left as NaNs. The infilling makes graphs easier on the eye, and allows full use of the valid data in 12-month moving averages, which remove seasonal variations. The following figure illustrates the infilling procedure:

VALIDATION PROCEDURE
ACORN-SAT is designed to be a homogeneous dataset, and it has many clusters of several stations that are close enough together that they should have a very similar climatology. Thus, ACORN-SAT has to pass the following checks:
- Its stations must have no major inhomogeneities
- Nearby stations must have similar temperature trends and fluctuations from year to year
- The adjustments made to raw data must match persistent step changes in the raw data
I use a “reference series” to facilitate the checks listed above, initially with Berkeley Earth (BEST) data as the reference, and others if BEST data is not available or is unsuitable. See the BEST page above for checks made on its suitability as a source of “reference series”.
More to follow …
