
Author: Dr Michael Chase, September 2019
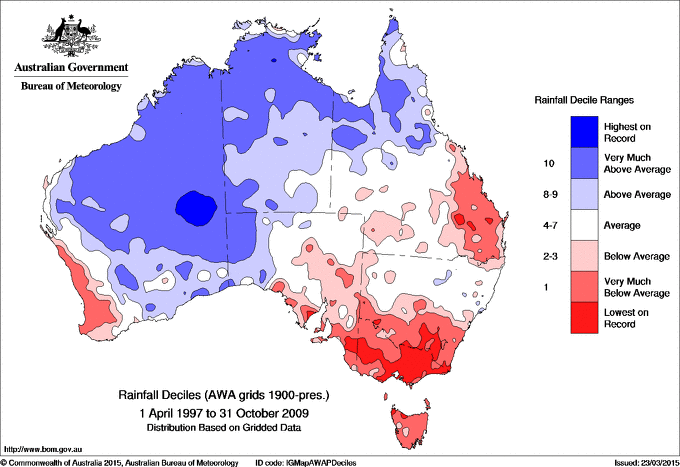
Update September 2021 Rainfall totals updated up to and including August 2021. Rainfall at Perth has had no obvious long-term trend since around the year 2000, and Perth currently does not feature on the BoM drought map:
************************************************************
This post gives a reconstruction back to 1876 of monthly totals of rainfall at Perth, Western Australia, effectively an estimate of the rainfall that would have been measured at Perth Airport if the current raingauge had been present at that location back to 1876.
The intention is to put the recent (2019) drought conditions in the area into the longest possible historical perspective. Data from Perth Airport (1944 to present), and nearby Perth Regional (meteorological) Office (1876 to 1992), are tested for inhomogeneities (none are found) and suitably scaled and plotted together to produce a composite record.
Seasonal Results
The following figure shows the seasonal rainfall totals:
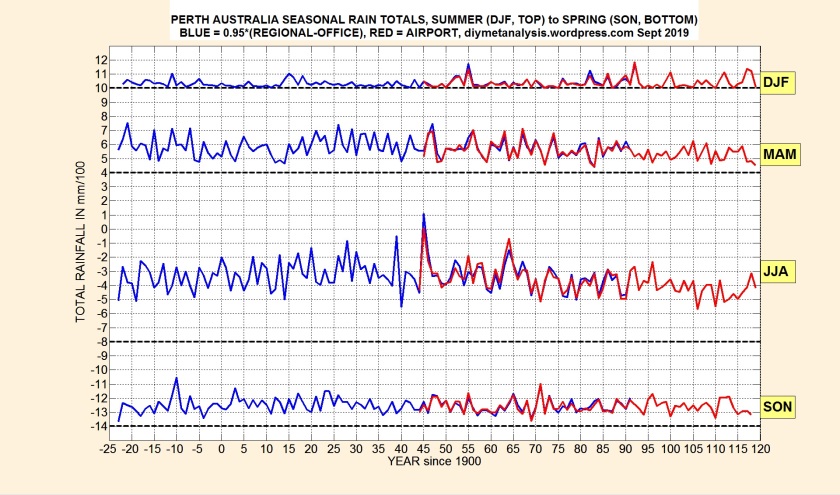
The data reveal that there has been no discernible change in the frequency of summer (DJF) dry spells, but summer wet spells have become more frequent and wetter.
Autumn (MAM) rainfall totals have declined since around 1990, relative to values before that date. See below for data for individual months.
Winter (JJA) rainfall has been at relatively low levels since around 2000, but are currently at levels similar to those in the late 19th century. There has been no discernible change in spring (SON) rainfall.
Annual Results
The following figure shows 12-month moving (one month at a time) totals of rainfall:
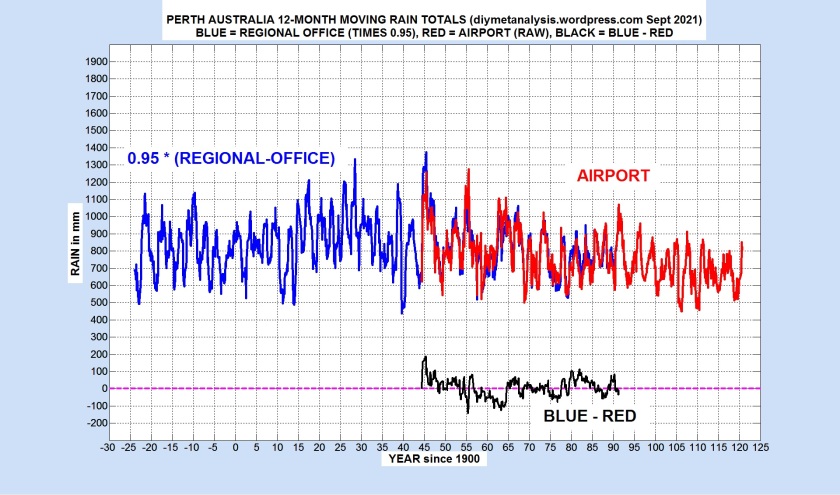
The figure above also shows the difference (black curve) between the two datasets in the overlap period, confirming that the scaling down of the early data by a factor of 0.95 is roughly correct.
Low 12-month totals can be seen in 2000, 2006 and 2010, but at levels similar to many previous dry spells, such as in 1940.
Monthly Results
The following 3 figures show the rainfall totals for individual months (Note: each figure has a different y-axis scale):
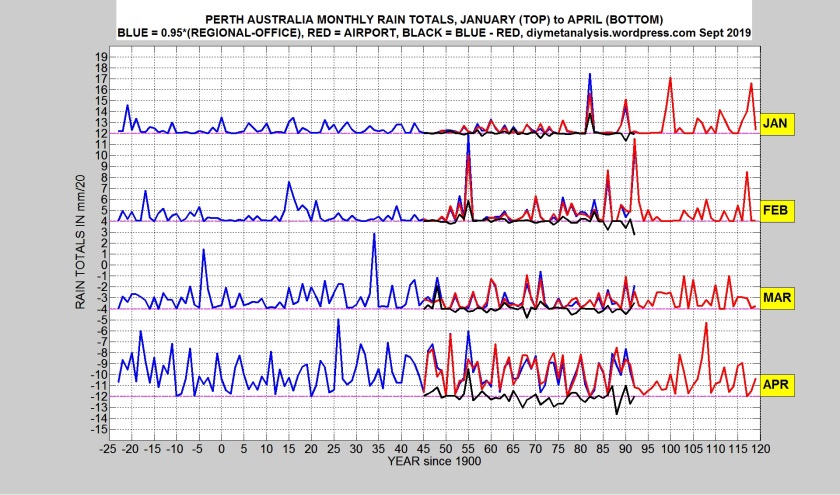
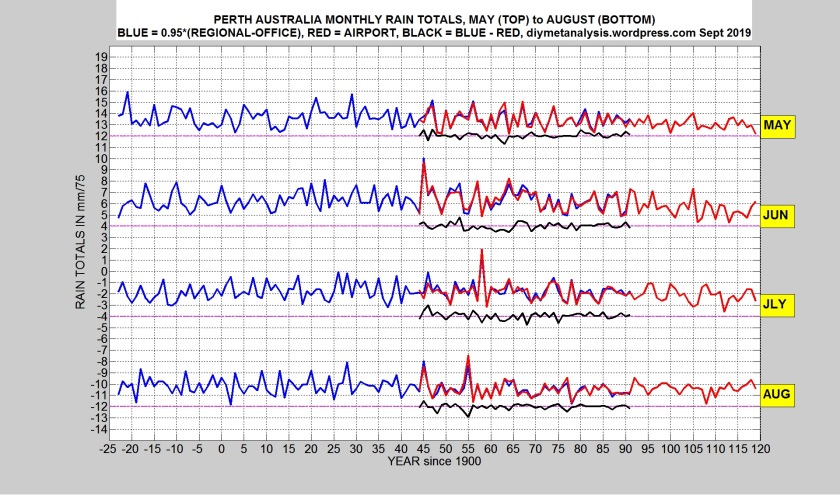
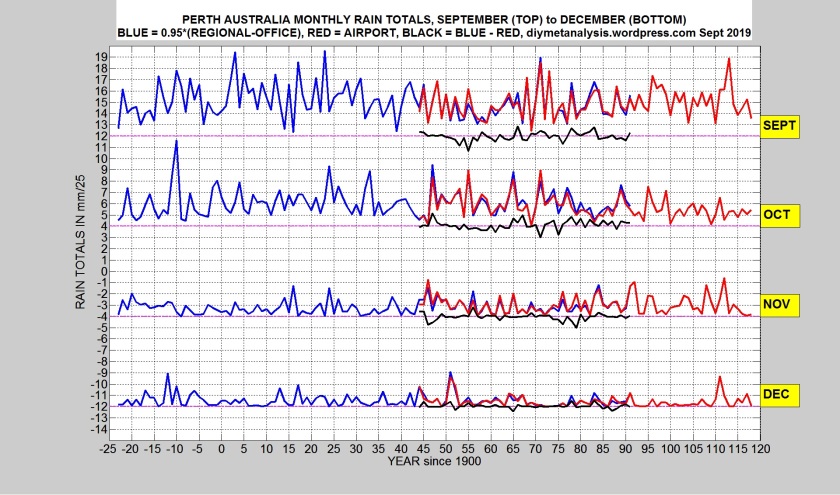
The low mean of the black differences confirms that 0.95 is a suitable scaling factor for the early data for all months.
It can be seen in the figures above that the main recent decline in rainfall at Perth has been in the relatively wet autumn/winter months of May and June.
VALIDATION
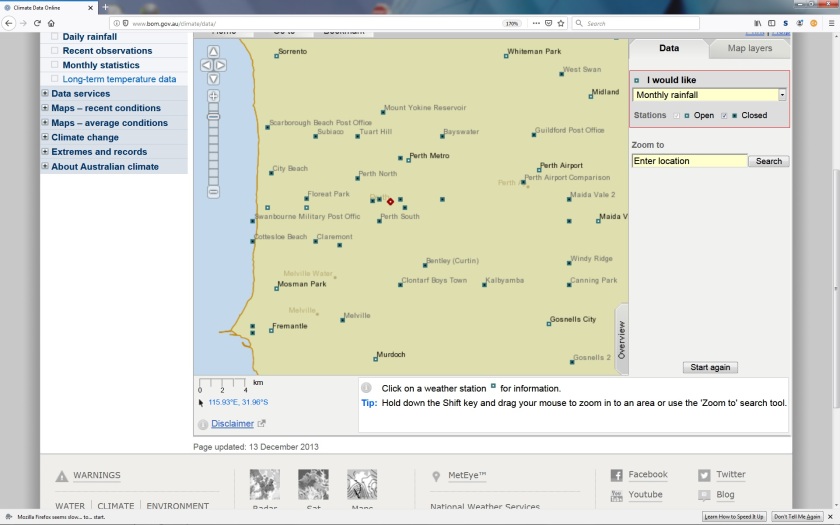
The data shown in the figures above are essentially raw data, so it is necessary to show that they are free from significant inhomogeneities (inconsistencies with neighbouring station data), such as may arise from station relocations or changes in local environment. The method used for inhomogeneity detection is a visual inspection of the differences in rainfall between each station shown and 49 neighbouring stations, some of which have to be relatively distant in order to cover the very early period in the 19th century.
Fortunately the densely populated city of Perth has had a high density of rainfall measuring stations, shown in the following map from the BoM website, allowing considerable confidence that the data shown is free of significant inhomogeneities:
The following 2 figures are examples of the station differences examined, the first one for Perth Regional Office, and the second one for Perth Airport. Any inhomogeneity in those datasets would appear as changes in the rainfall differences that are consistent (and persistent) across all stations. An example of an inhomogeneity detected by this method is shown in the previous post on Cape Town rainfall, but nothing has been detected for the Perth data used in this post.
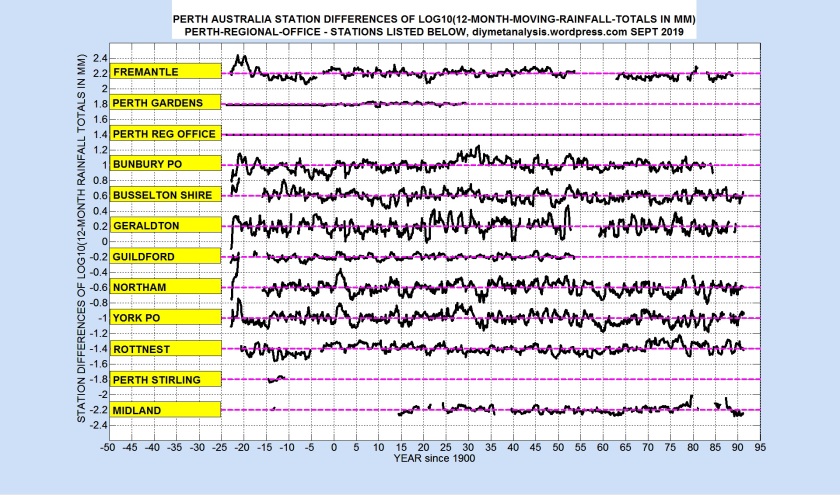
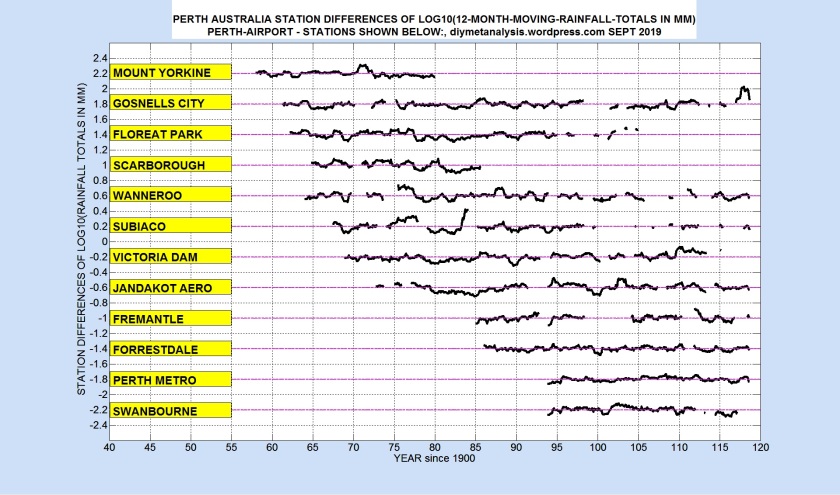
Note the smaller differences in rainfall for Perth Airport, due to the neighbours being closer than they are for Regional Office, but note also the worrying feature that more data are missing than a hundred years ago.
Appendix
Some technical issues are explained in this appendix, which ends with details of the station data used.
Some missing early data are infilled using neighbouring data, this allows full use of the existing data in the 12-month moving totals that provide the necessary smoothing for visual inhomogeneity testing. The stations/months infilled are indicated in the station list below.
Differences of station rainfall are computed as difference of LOG10(12-month-moving-totals), reflecting the fact that rainfall totals tend to differ between stations by multiplicative factors rather than the additive offsets assumed for temperature differences. Purely for display purposes the average of all the difference data for a particular station pair is subtracted from each datum, so that the result has zero mean, allowing it to be placed at the desired location on the plots.
Stations used are as follows, the id is the one used by the BoM, which provided all the data for free from their “Climate Data Online” website:
stations = […
% BoMid From To
01 09001 1901 2017;… % ARMADALE
02 09095 1921 1930;… % BAYSWATER
03 09503 1897 2014;… % BOYANUP
04 09514 1877 1985;… % BUNBURY PO
05 09515 1877 2019;… % BUSSELTON SHIRE
06 09516 1914 2002;… % CAPEL
07 09079 1888 1928;… % CLAREMONT
08 09189 1916 1926;… % COTTESLOE BEACH
09 09538 1934 2019;… % DWELLINGUP
10 09702 1915 1945;… % DWELLINGUP RAILWAY
11 09056 1962 2005;… % FLOREAT PARK
12 09257 1986 2019;… % FORRESTDALE
13 09017 1852 1989;… % FREMANTLE (INFILLS 1897 APR–>JULY)
14 09192 1983 2019;… % FREMANTLE OPEN
15 08050 1877 2019;… % GERALDTON
16 09119 1950 1989;… % GNANGARA
17 09106 1961 2019;… % GOSNELLS CITY
18 09020 1928 1990;… % GREENMOUNT
19 09022 1877 1954;… % GUILDFORD
20 09572 1889 2001;… % HALLS HEAD (MANDURAH) 4 INFILLS 1892–>1903
21 09172 1972 2019;… % JANDAKOT AERO
22 09074 1900 1907;… % KALBYAMBA
23 09068 1956 2001;… % MELVILLE
24 09025 1886 2019;… % MIDLAND
25 09012 1958 1981;… % MOUNT YORKINE
26 09035 1940 1974;… % NEDLANDS
27 10111 1877 2019;… % NORTHAM
28 09021 1944 2019;… % PERTH AIRPORT
29 09097 1876 1930;… % PERTH GARDENS
30 09087 1905 1923;… % PERTH HIGHGATE HILL
31 09225 1993 2019;… % PERTH METRO
32 09098 1907 1934;… % PERTH NORTH
33 09034 1876 1992;… % PERTH RO (TIMES 0.95 TO MATCH AIRPORT)
34 09100 1885 1892;… % PERTH STIRLING
35 09036 1897 1995;… % ROCKINGHAM PO
36 09038 1879 1995;… % ROTTNEST LIGHTHOUSE (INFILLS ALL 1893 NaNs)
37 09129 1964 1986;… % SCARBOROUGH BEACH PO
38 09102 1898 1938;… % SUBIACO
39 09151 1967 2019;… % SUBIACO TREATMENT
40 09061 1954 1974;… % SWANBOURNE PO
41 09215 1993 2018;… % SWANBOURNE
42 09216 1968 2018;… % VICTORIA DAM
43 09105 1905 1930;… % WANNEROO EARLY
44 09105 1964 2019;… % WANNEROO LATE
45 09163 1917 2004;… % WEST SWAN
46 09263 2004 2019;… % WHITEMAN PARK
47 09059 1935 1950;… % WINDY RIDGE
48 09045 1934 2000;… % YANCHEP
49 10144 1877 1996]; % YORK PO
End of Post

One thought on “Example 07: PERTH WA Rainfall”