Example 11: MELBOURNE Rainfall

Author: Dr Michael Chase (October 2021)

This article is about a composite monthly rainfall reconstruction for Melbourne Australia from 1855 to 2021. The composite is comprised of station data Yan Yean to June 2015, multiplied by 1.1, then nearby Wallan to the currently latest date. The expectation was that Yan Yean data would be OK for the entire period, maybe with rescaling needed for non-climatic changes, but it was found that Yan Yean data is seriously deficient from July 2015 onwards. Missing years of 1979 and 1980 were infilled using the monthly data of Melbourne Airport.

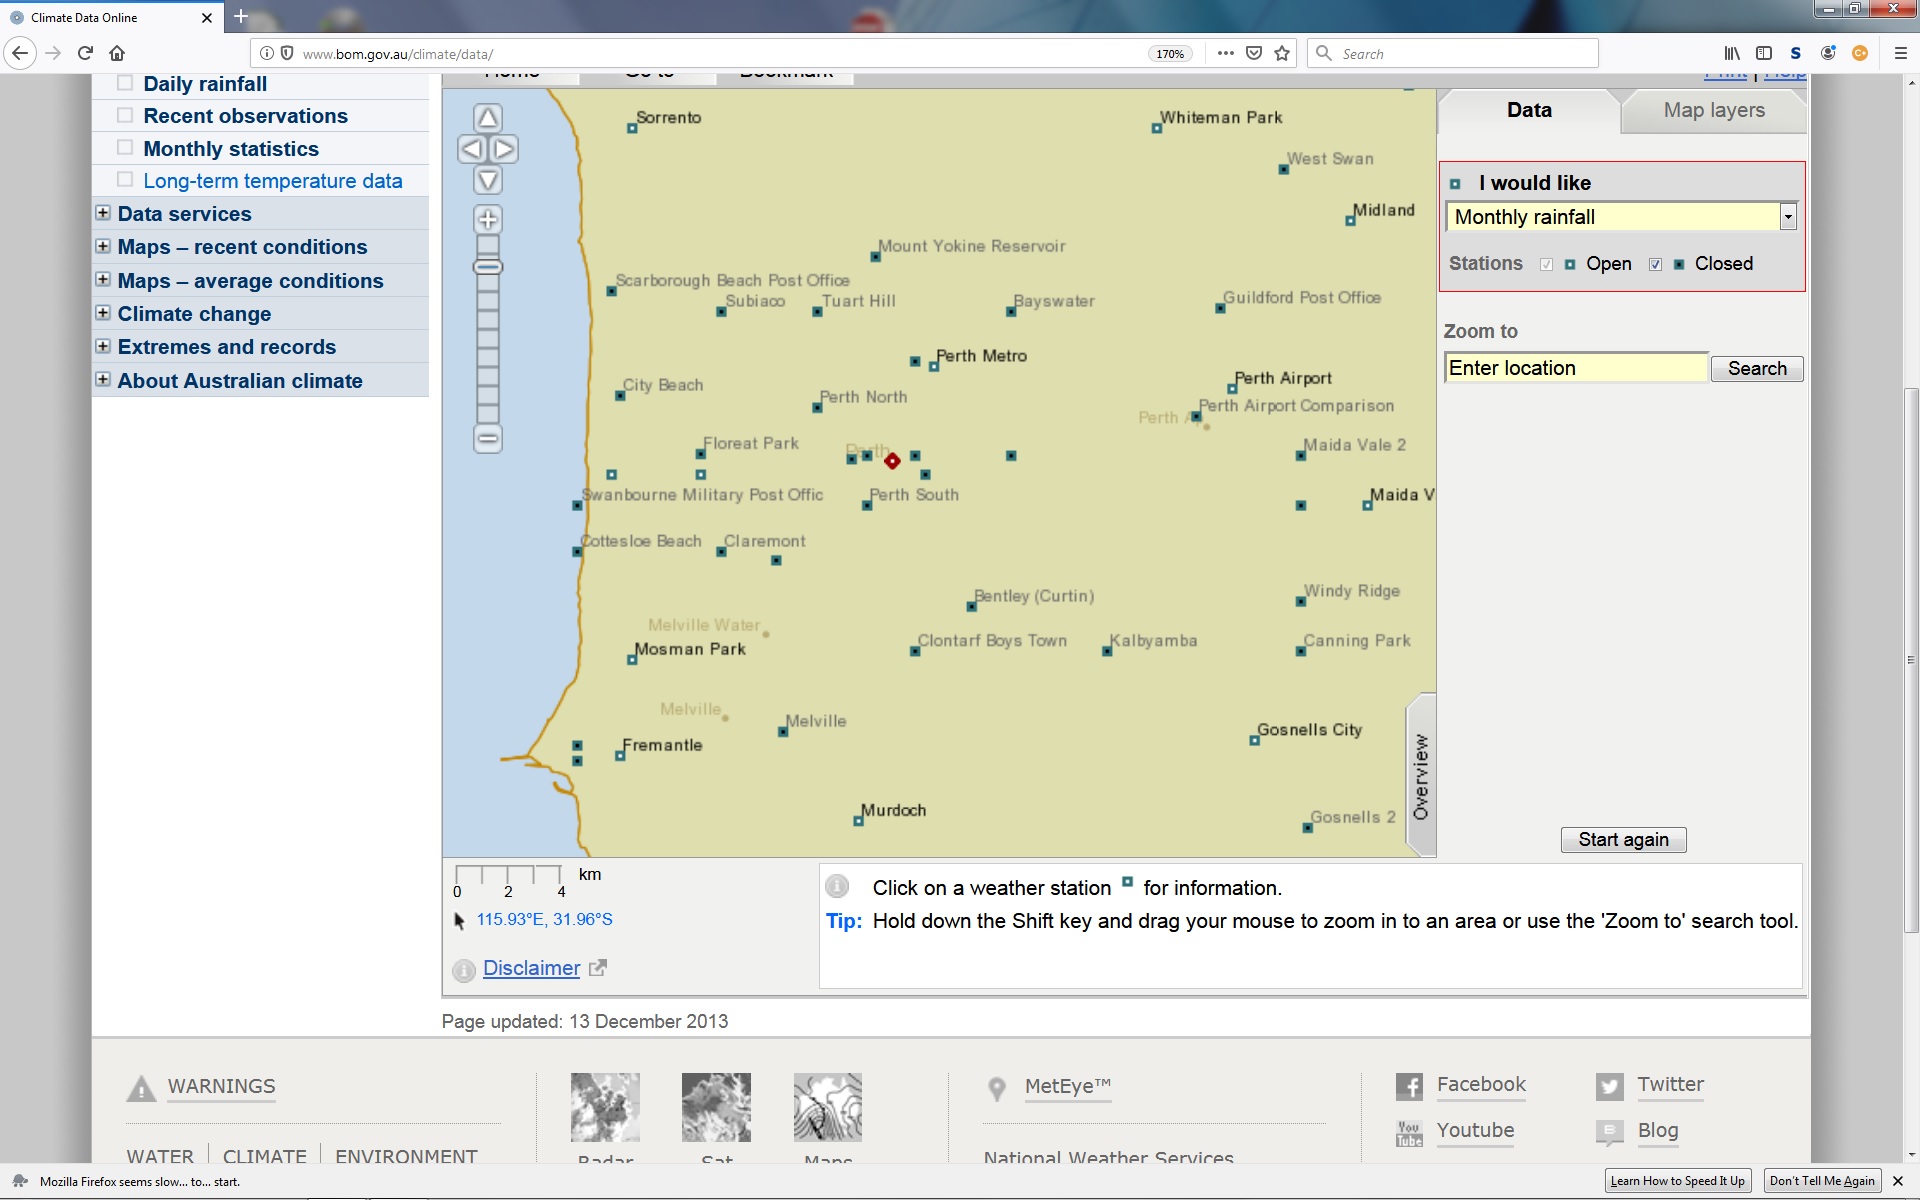
The following photo shows Yan Yean reservoir:

20 station records were examined in the area, checked for inhomogeneities, and mostly infilled with daily data from near neighbours. Most missing months of data are due to just one or two missing days, and the monthly totals can be estimated with very little error using the daily data of near neighbours.

Several open stations near Yan Yean have the same problem with recent years of data, but it was found that Wallan (BoM id 88162) is suitable (when scaled to match Yan Yean) as the recent data in the composite record.

Melbourne Composite Rainfall, 12-month moving totals:

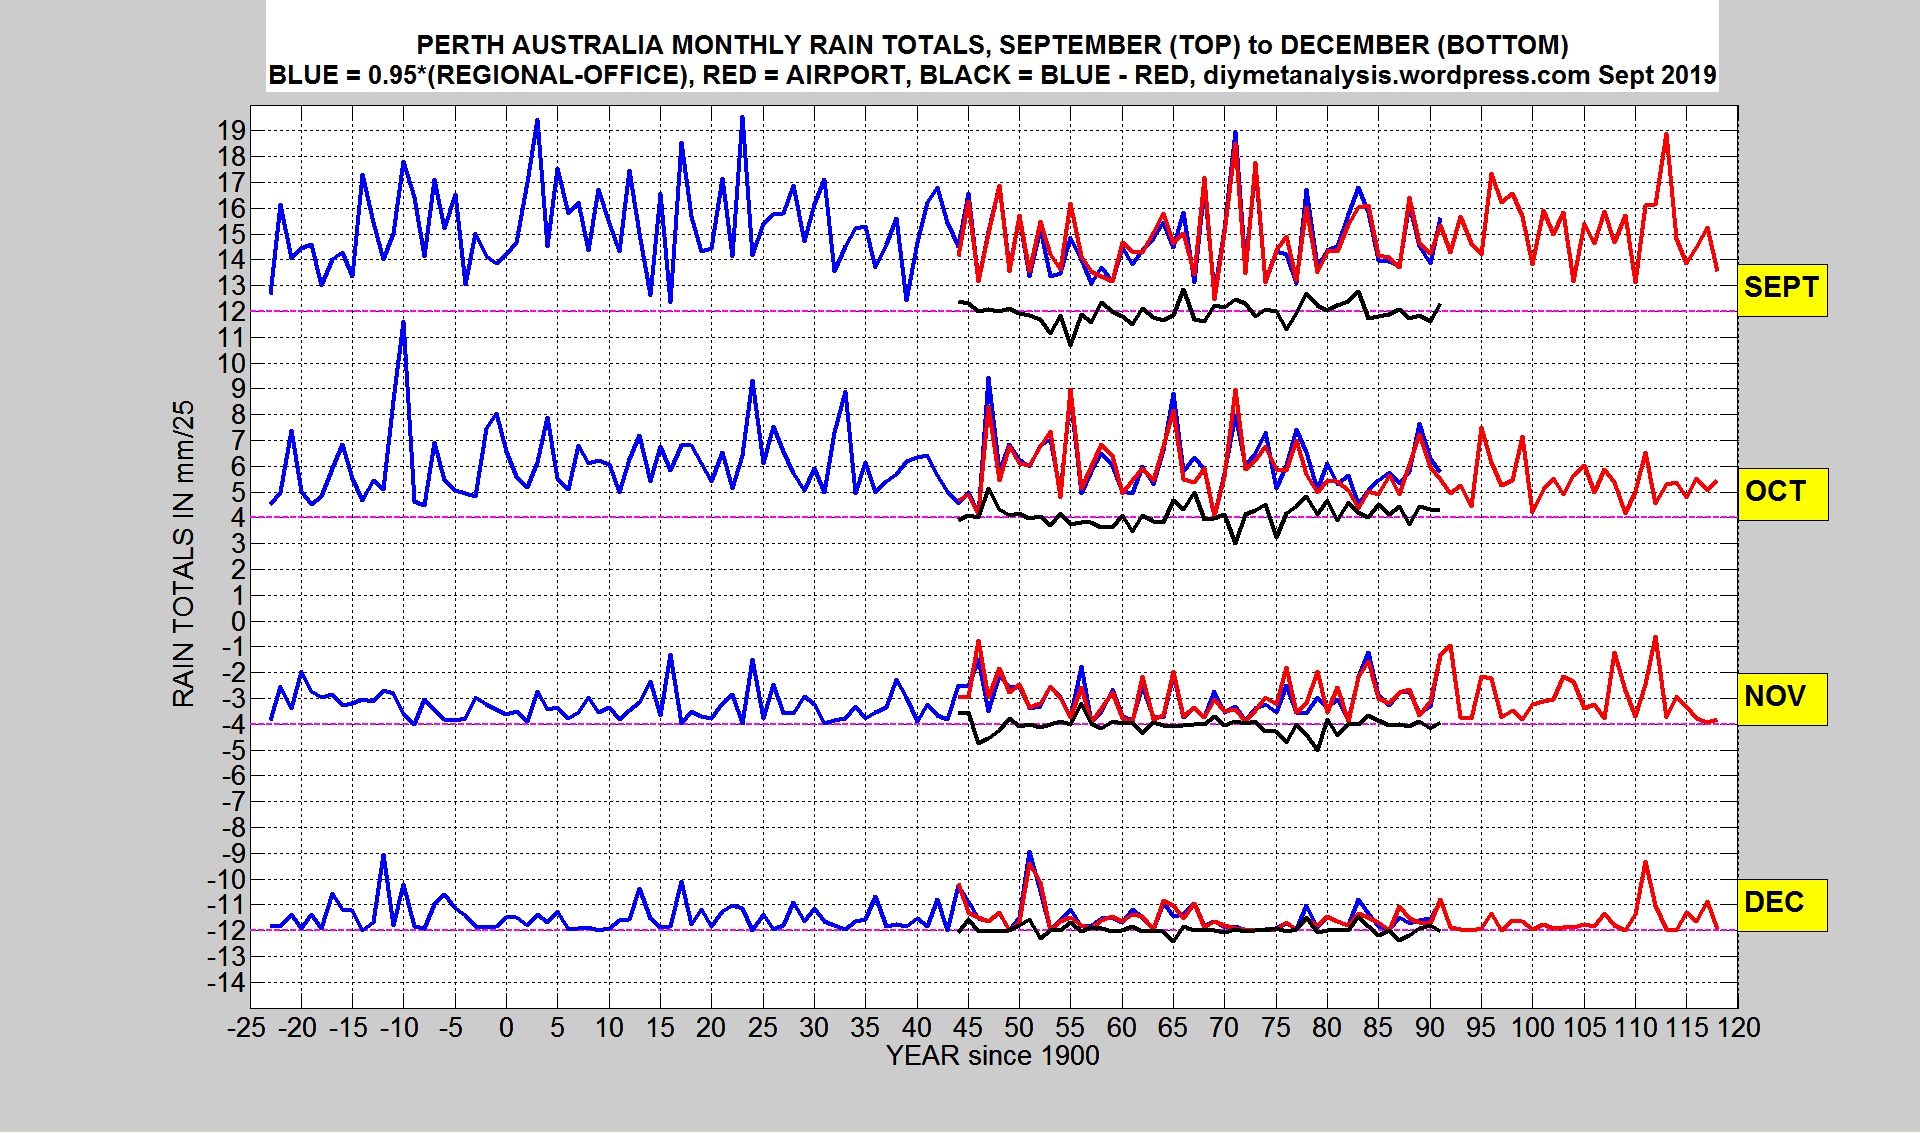
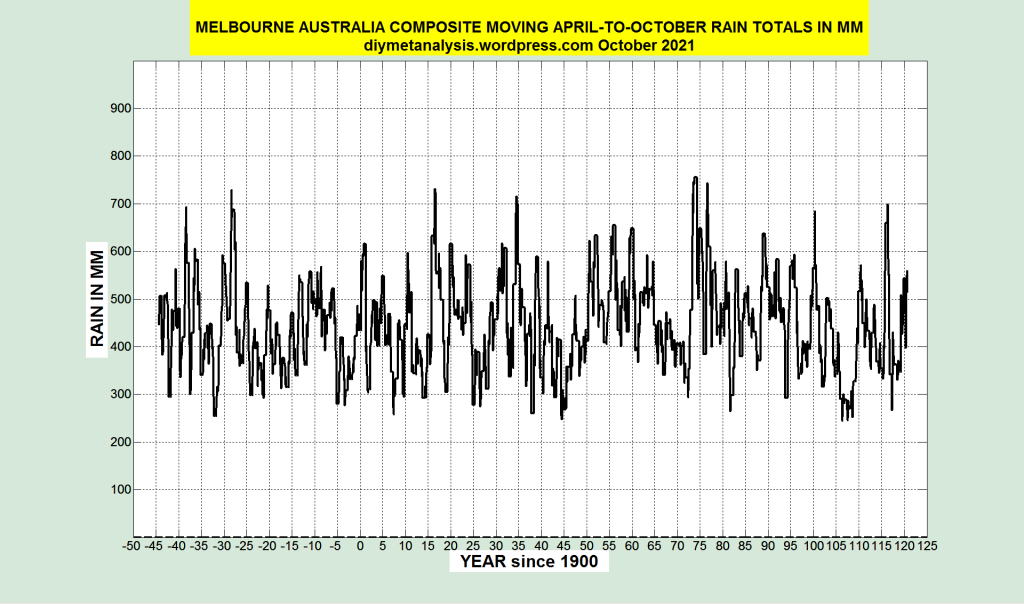
Melbourne Composite Rainfall, cool season (April-October) moving totals, shown here because it has been claimed that rainfall in this season is “in decline”:

HOMOGENEITY TESTING

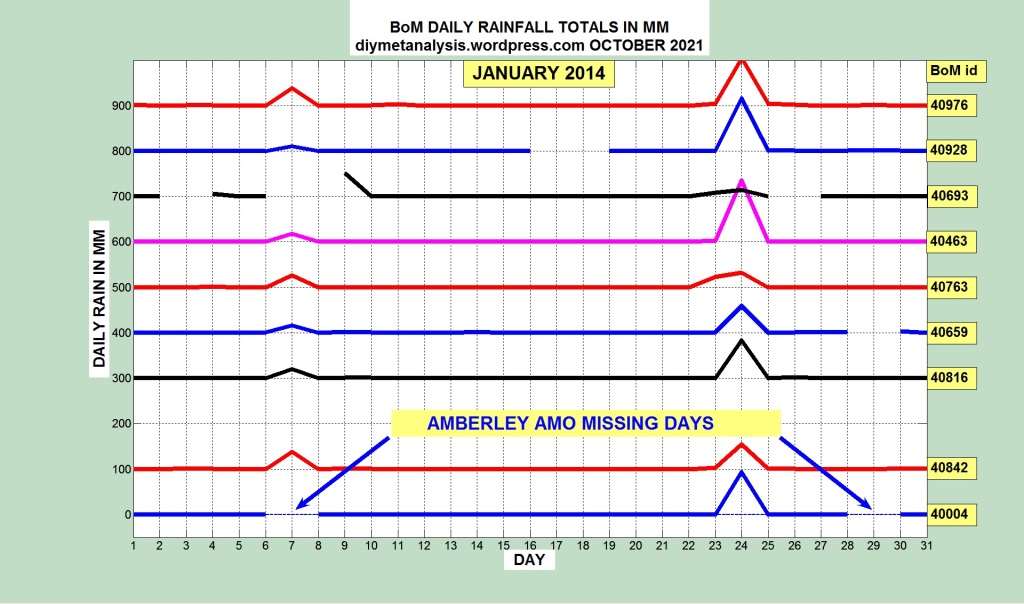
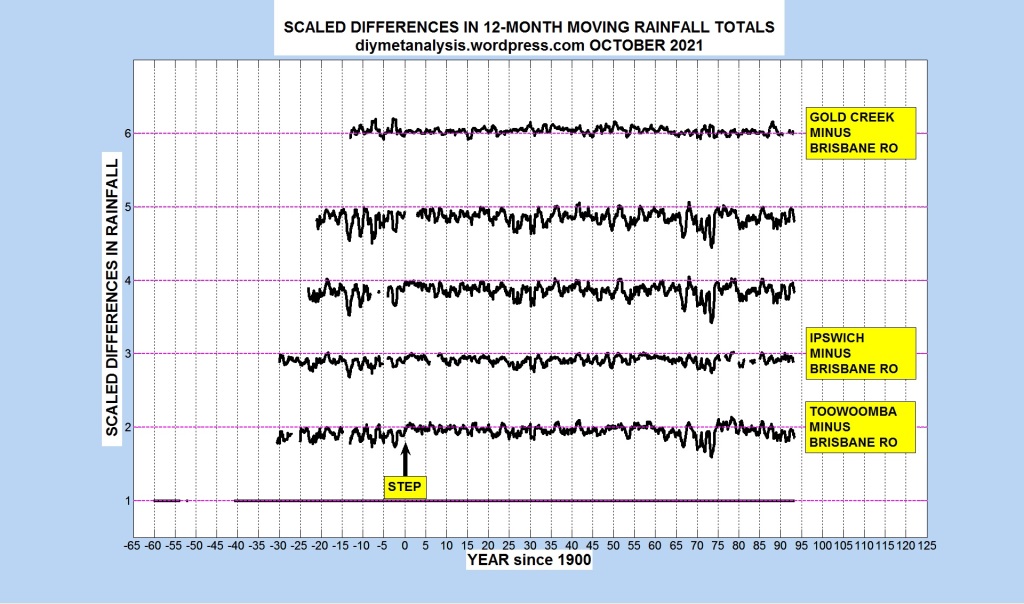
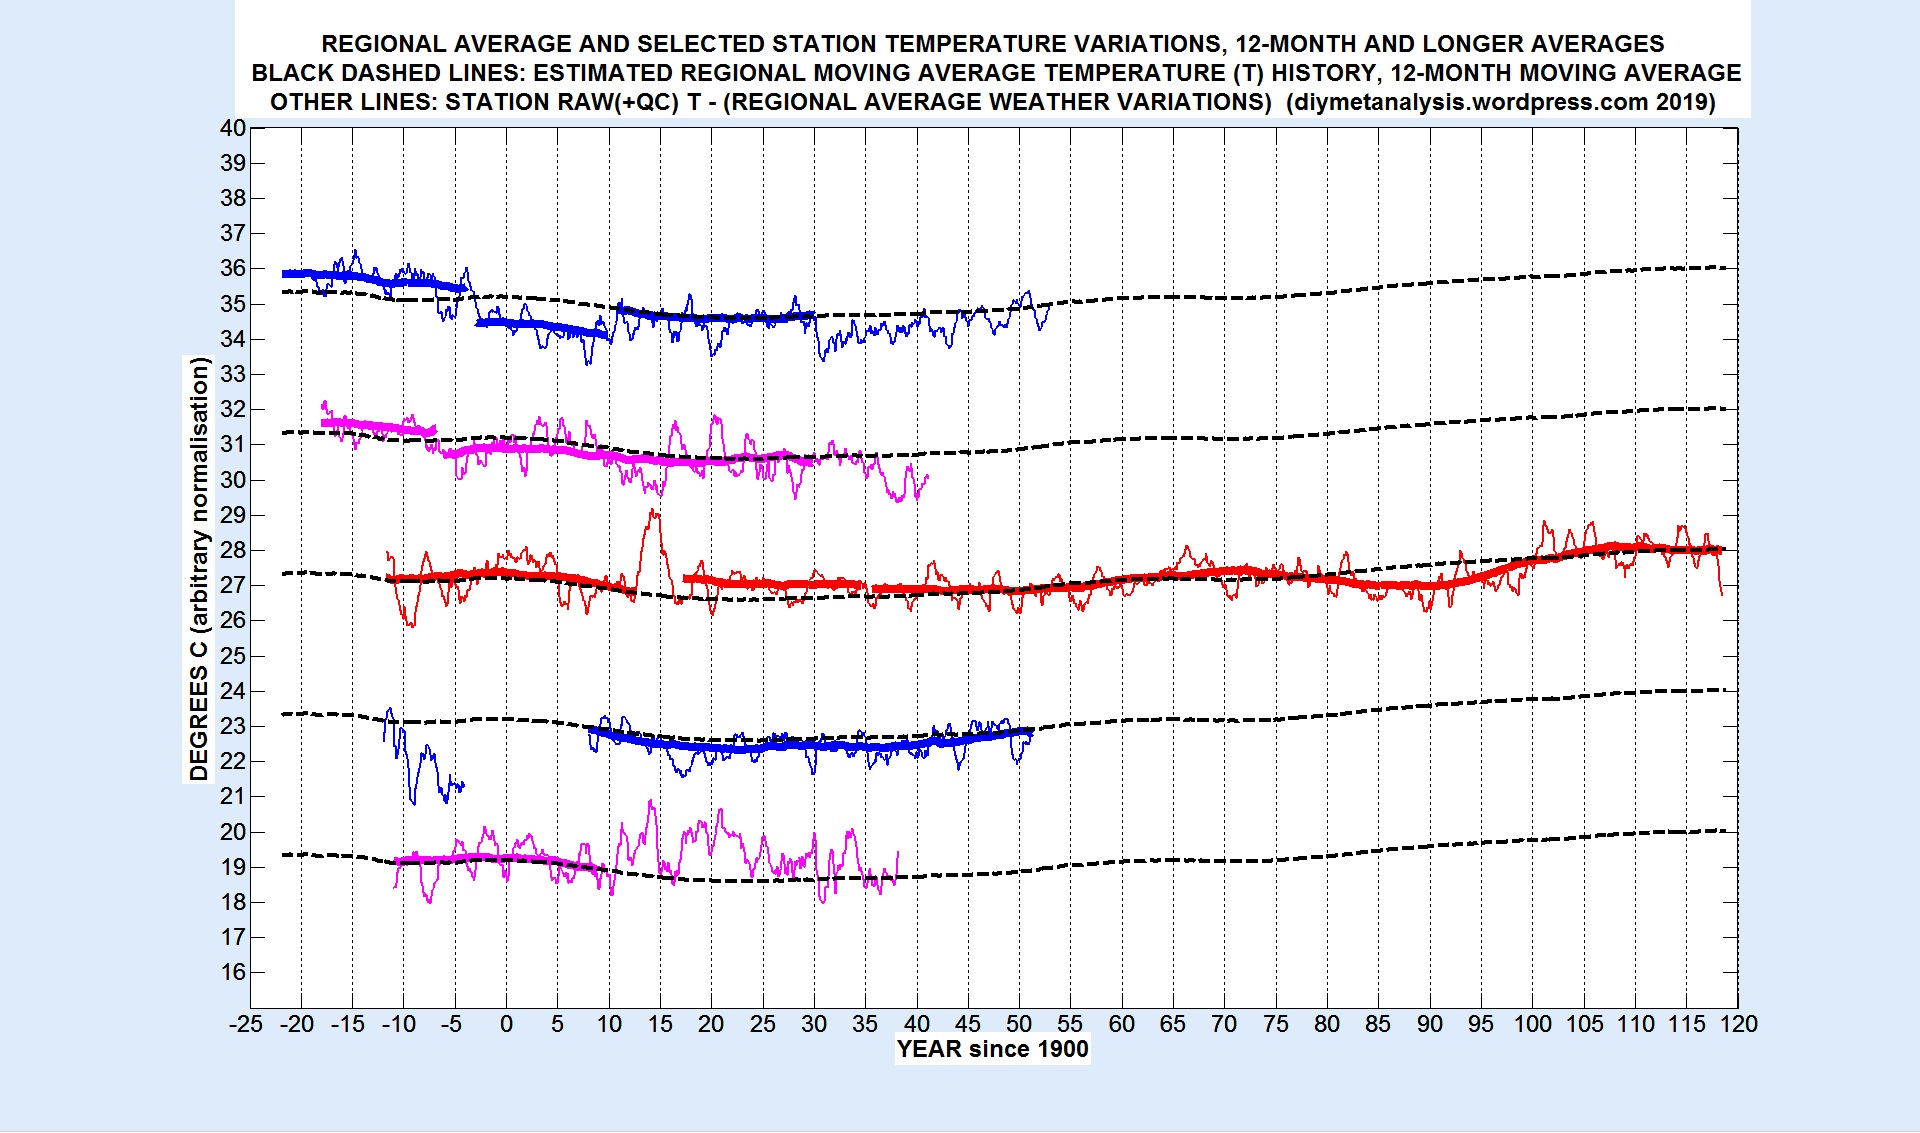
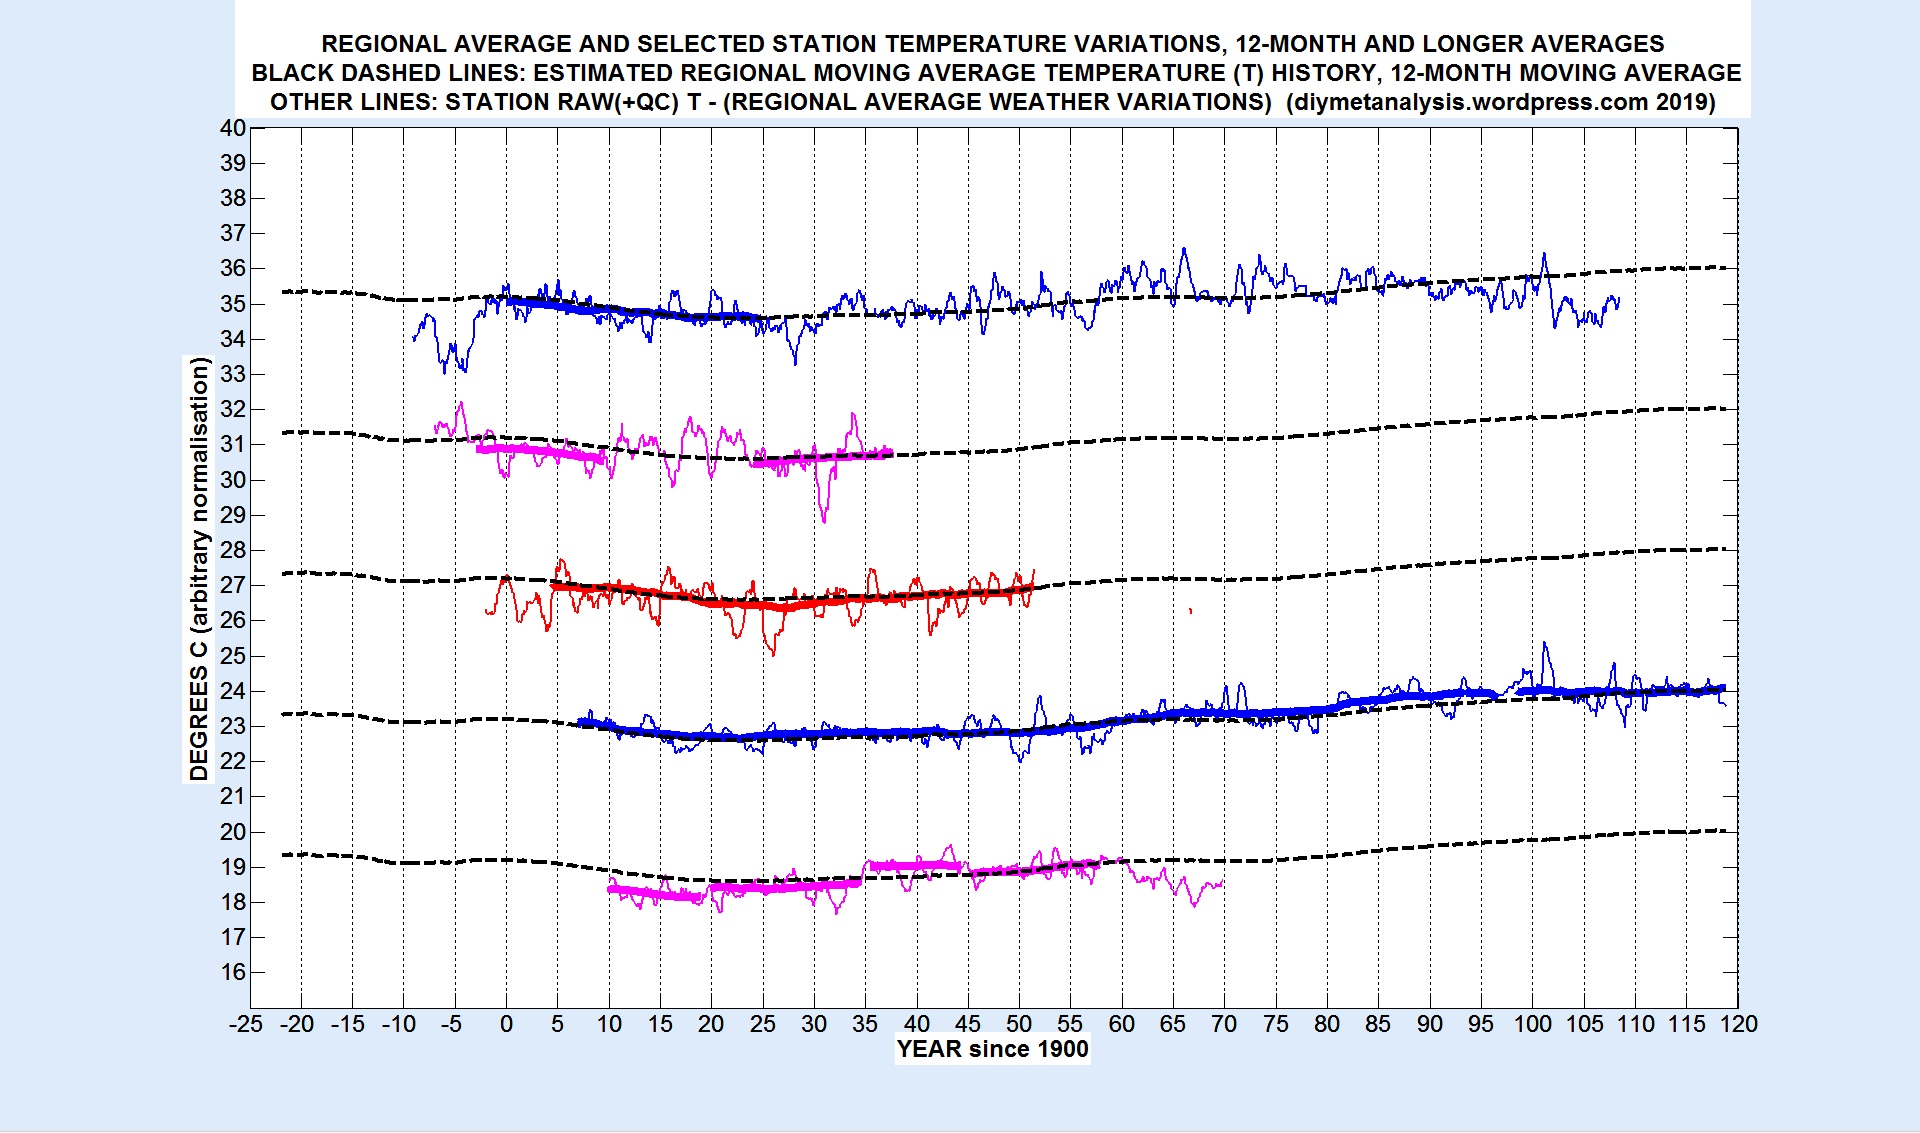
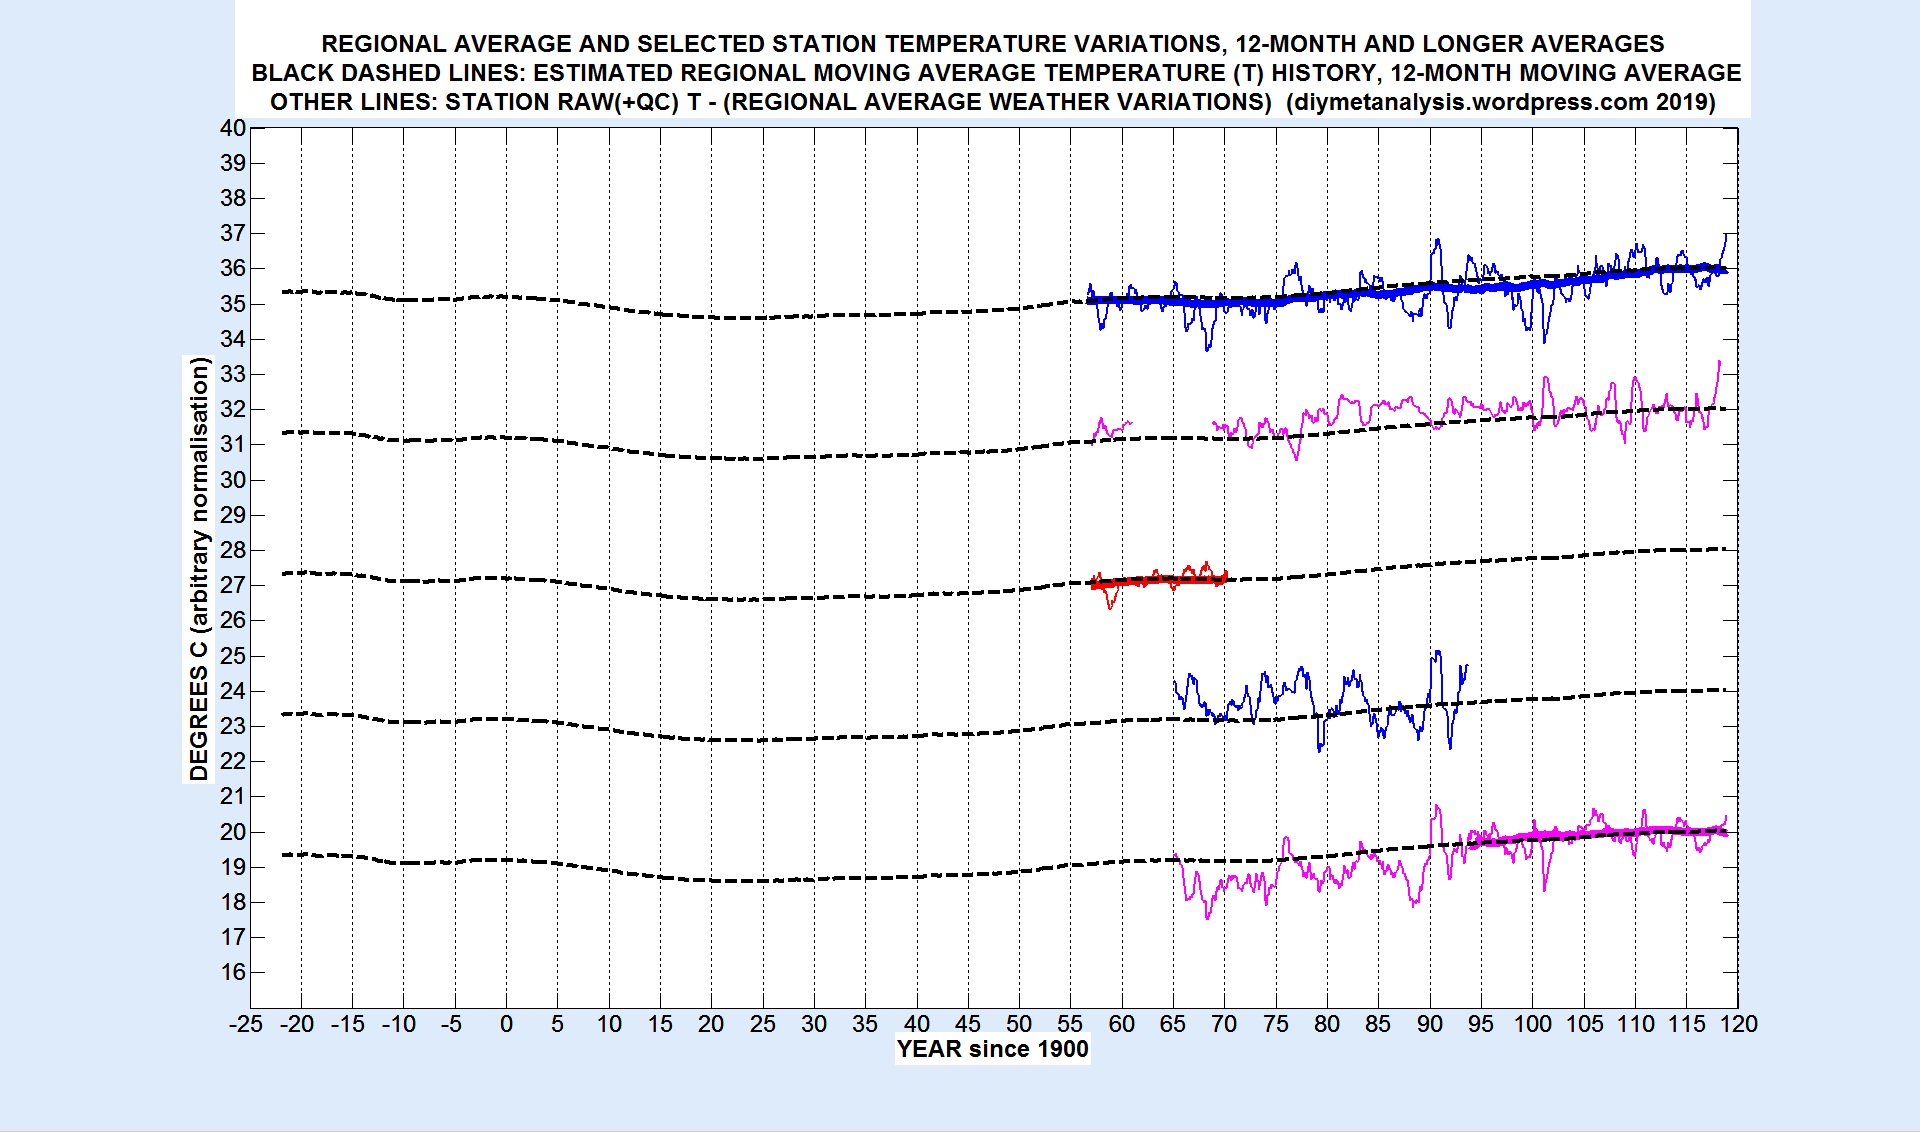
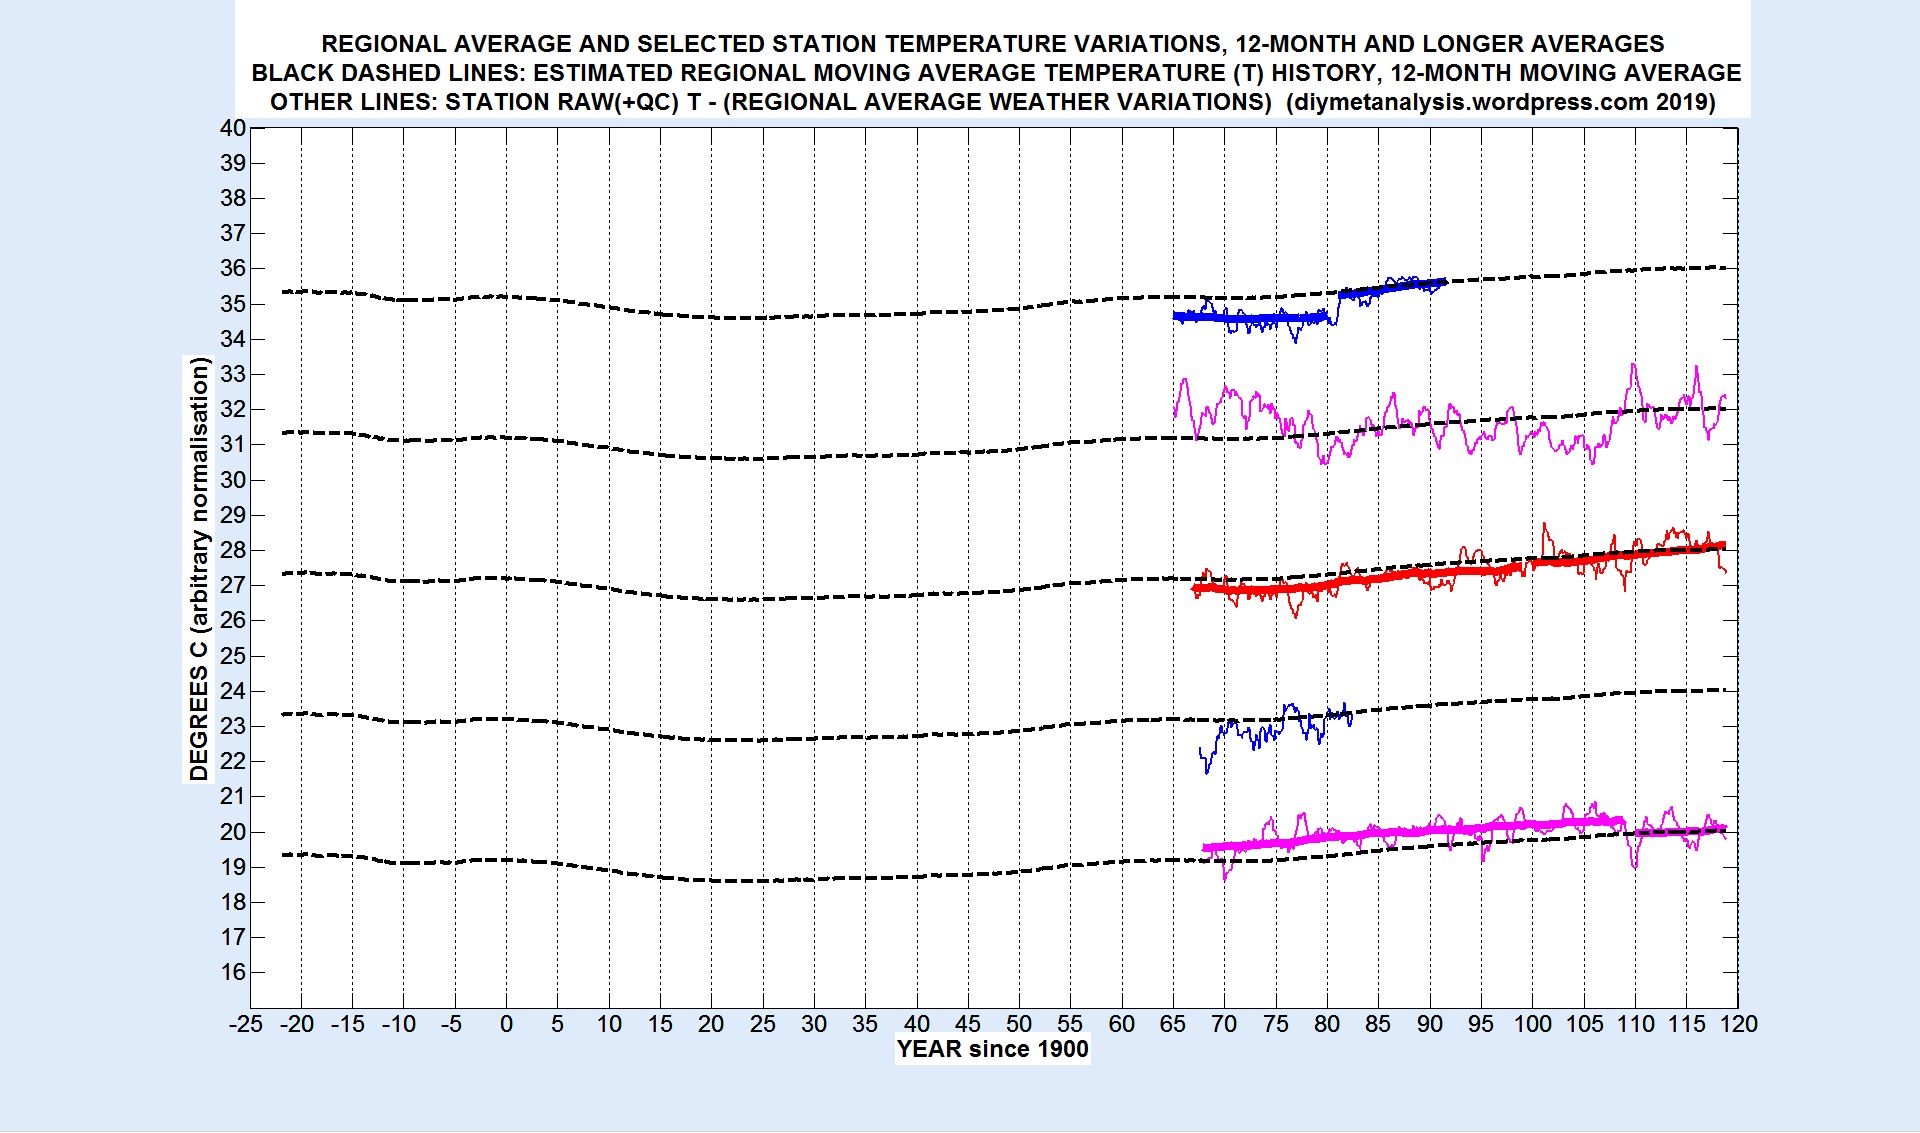
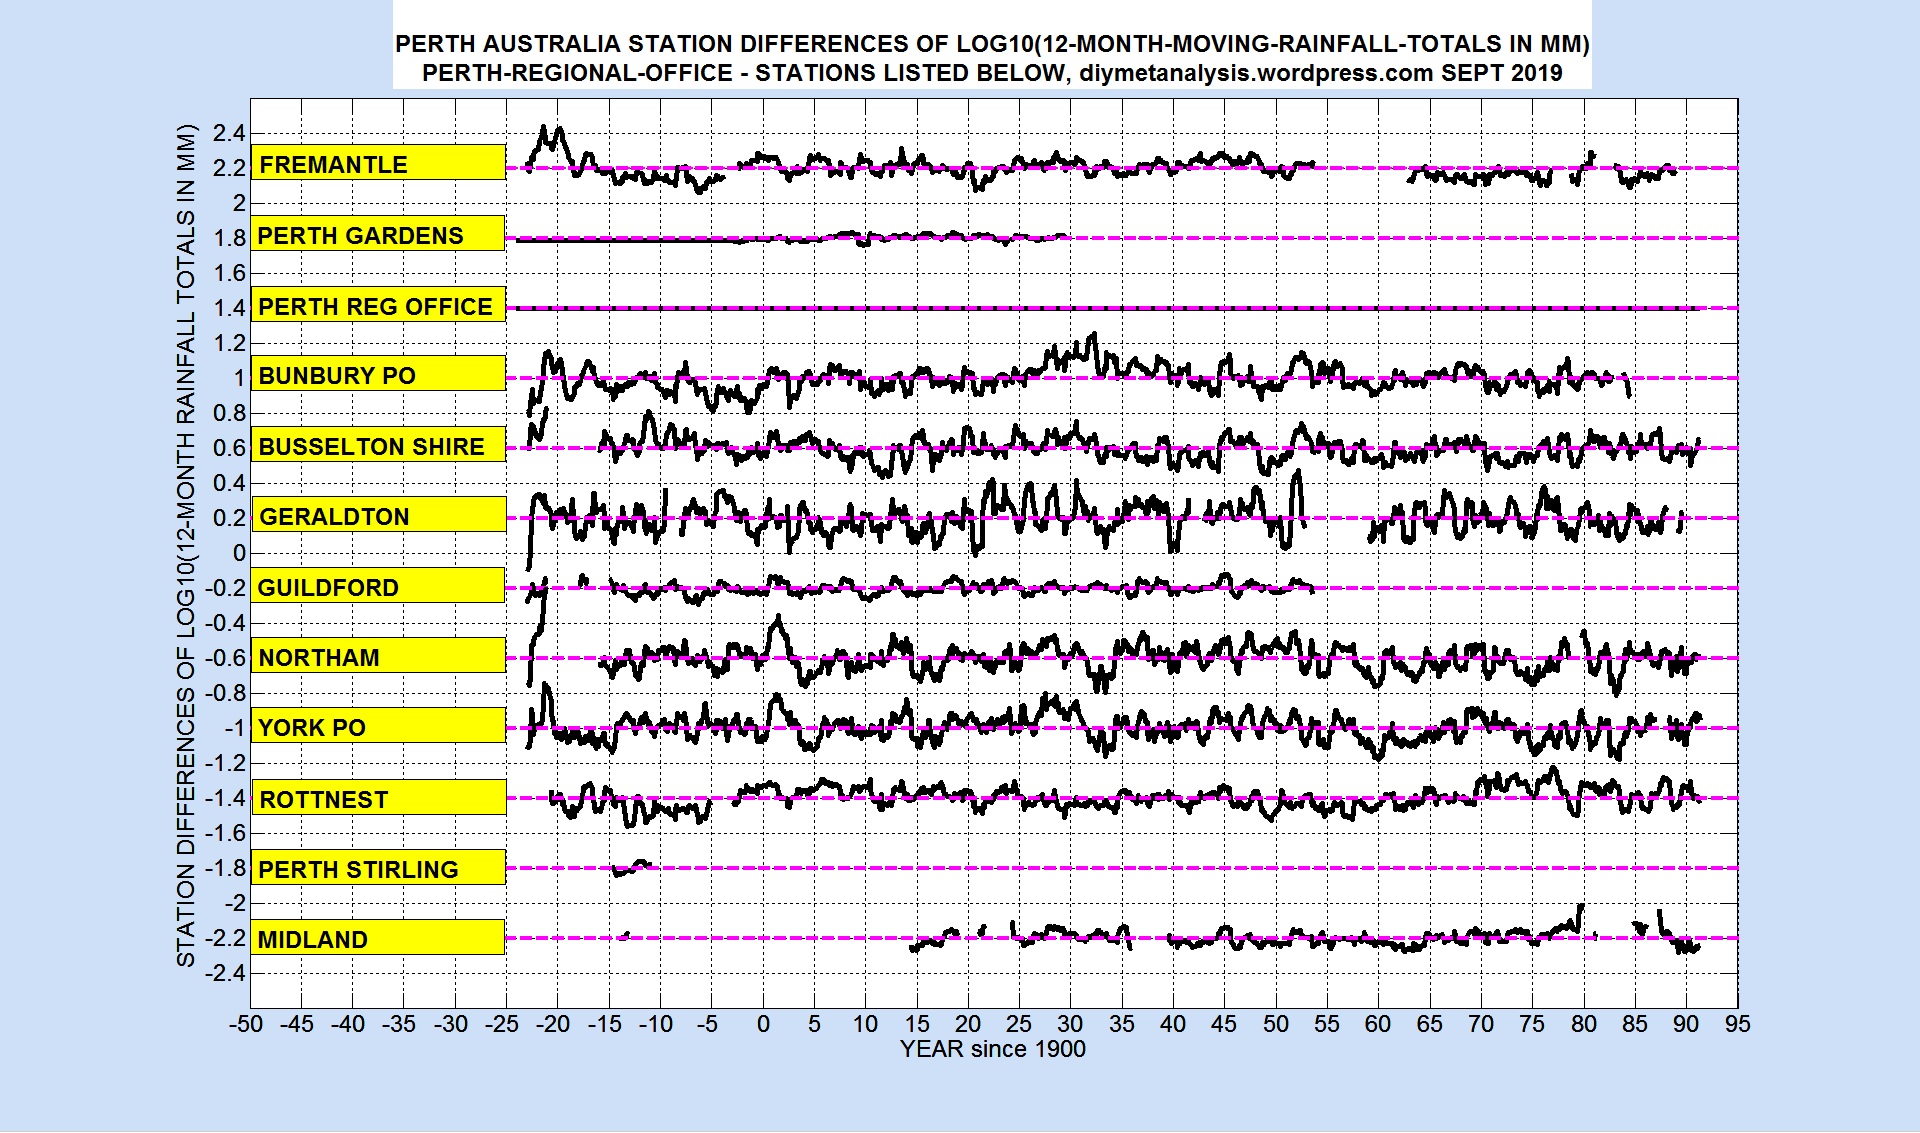
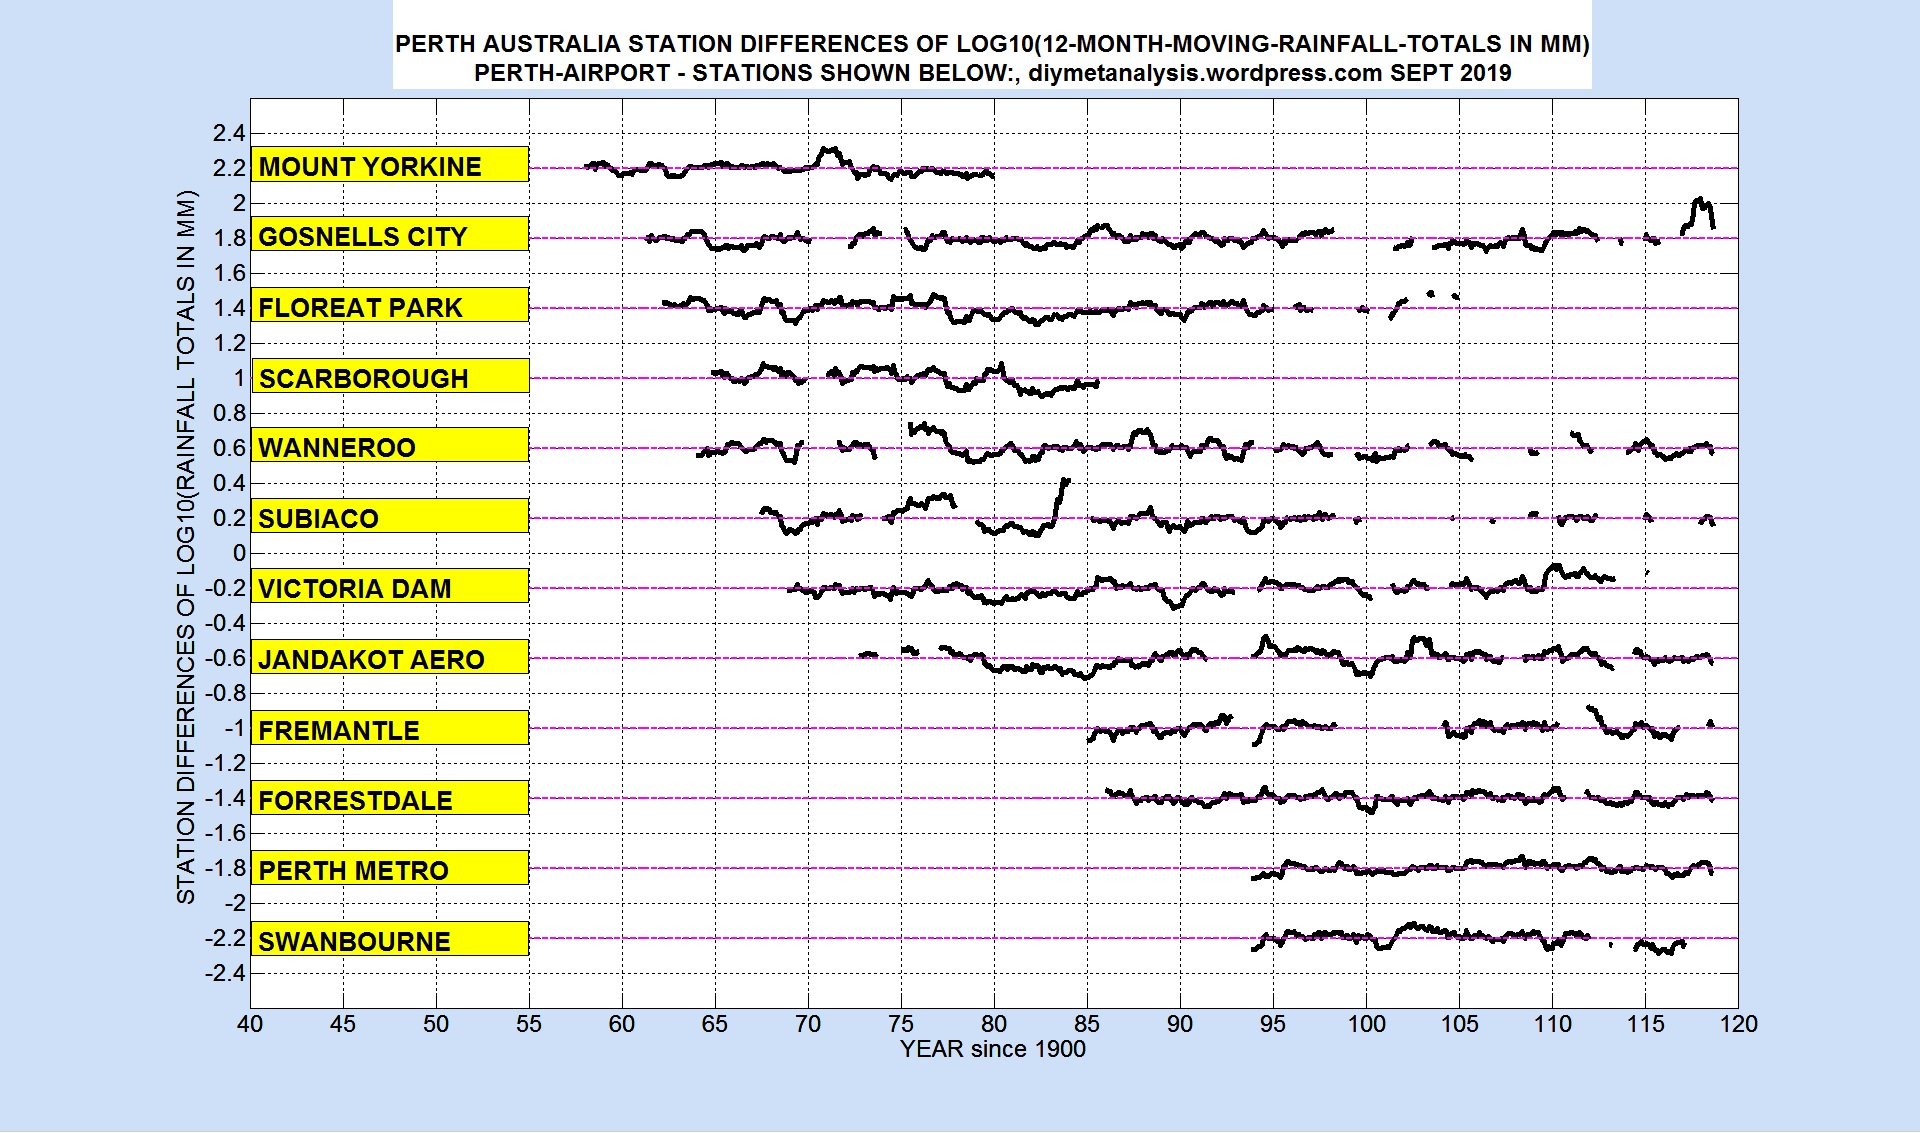
The following figures show the homogeneity checks performed on the constituent records, Yan Yean (86131) and Wallan (88162):

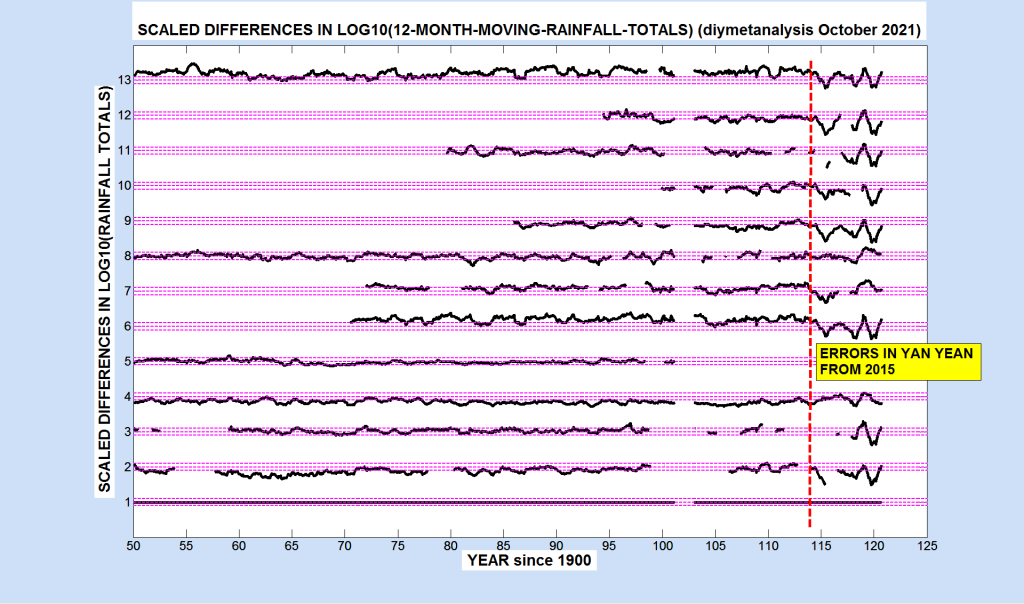
Note in the figure above the consistency of the differences with other stations from 2015, establishing that the errors are within the Yan Yean data.

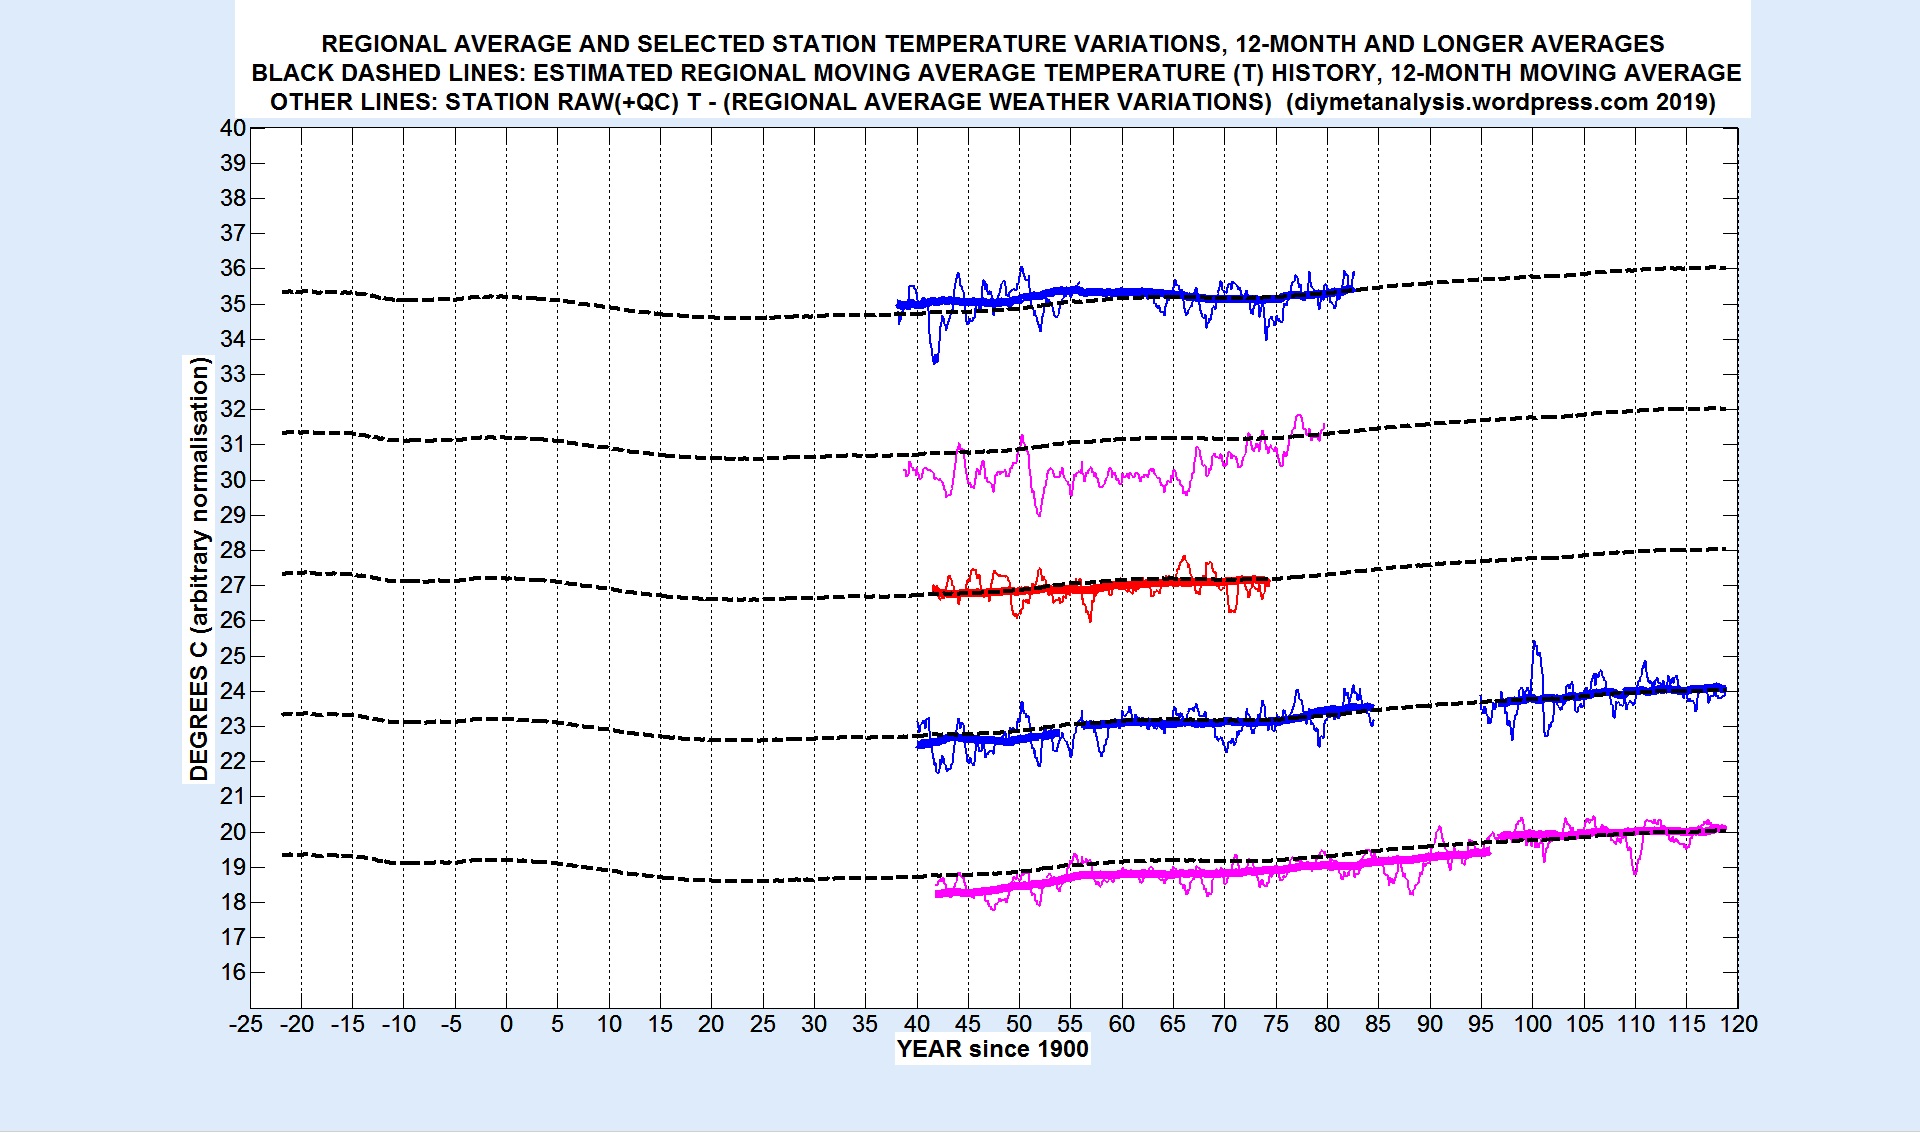
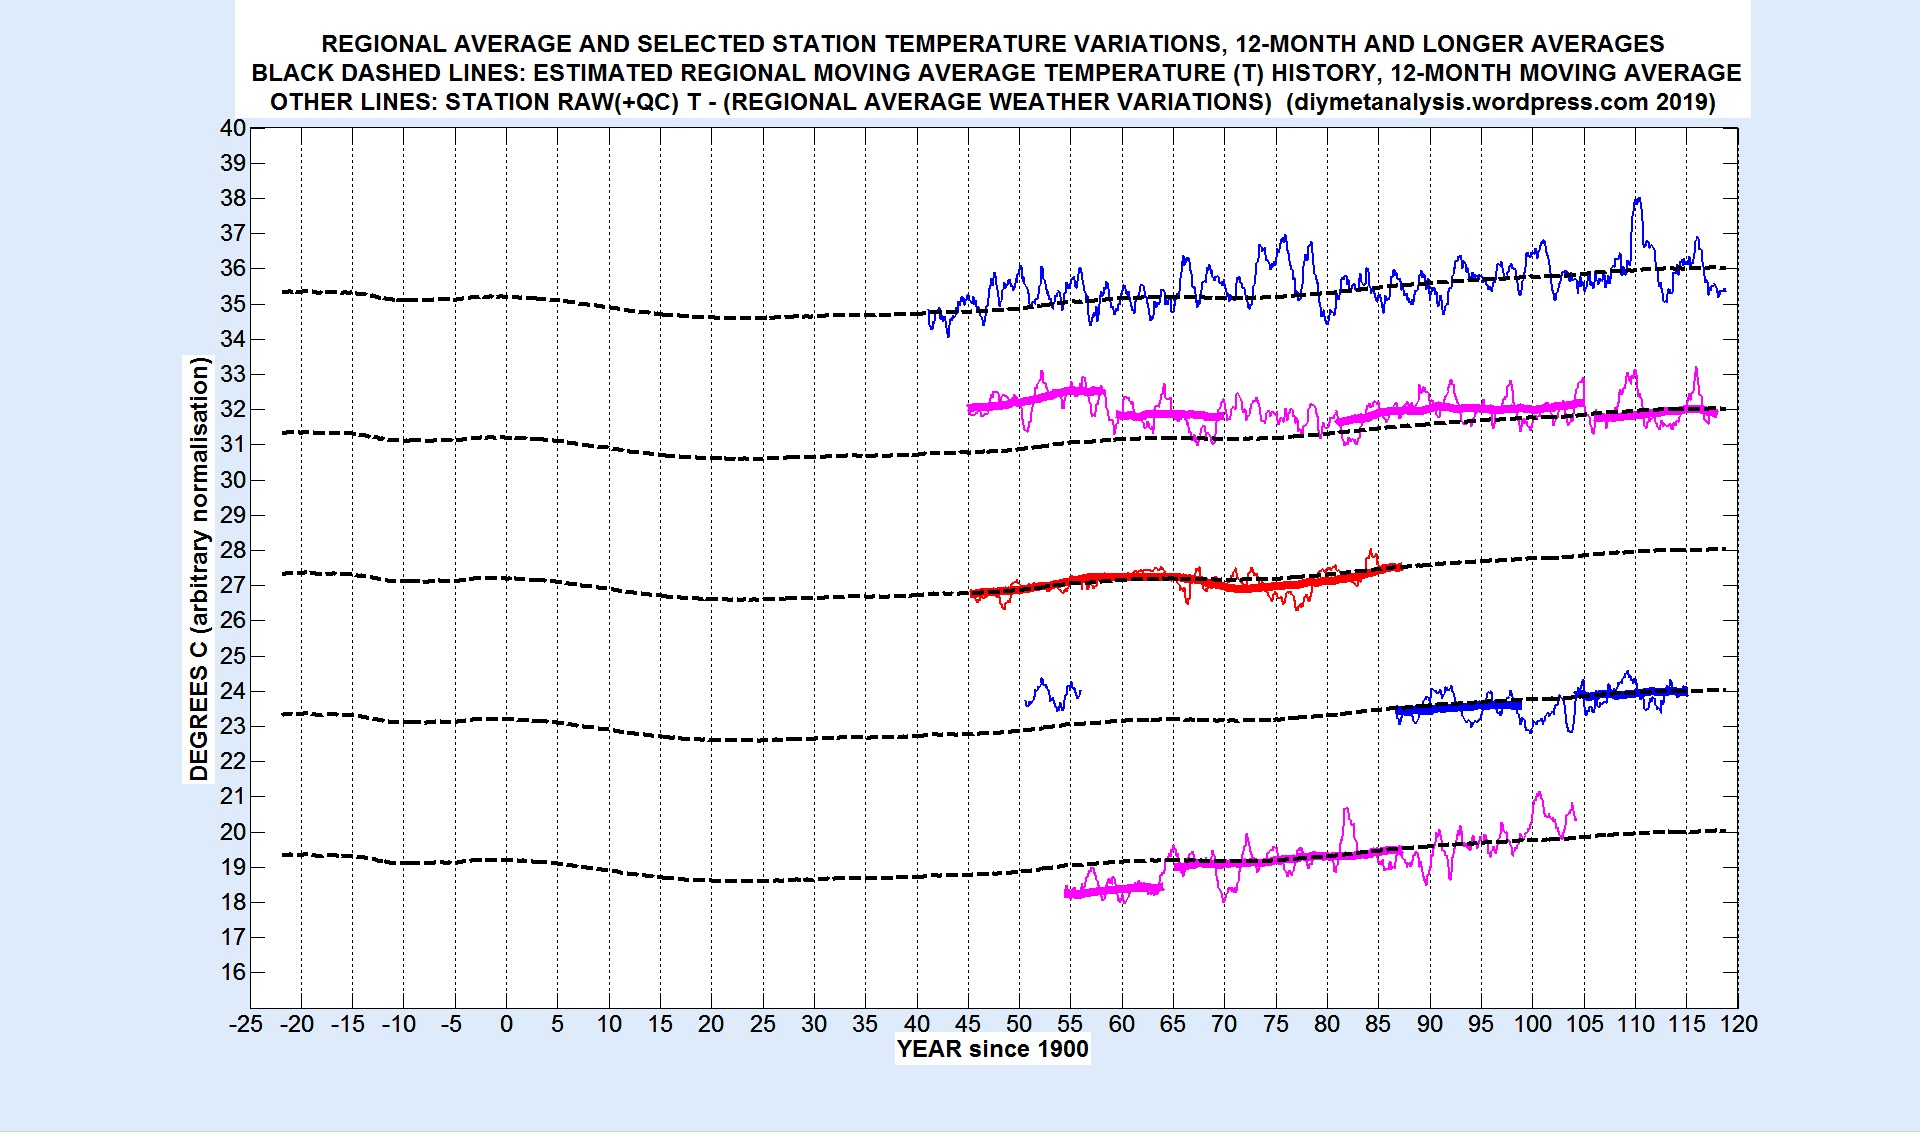
The figure above establishes that the Wallen data is free from major errors and inhomogeneities from around the year 2000, giving enough (15 years) of an overlap with Yan Yean (to 2015) to obtain a scaling factor for the merging of data.
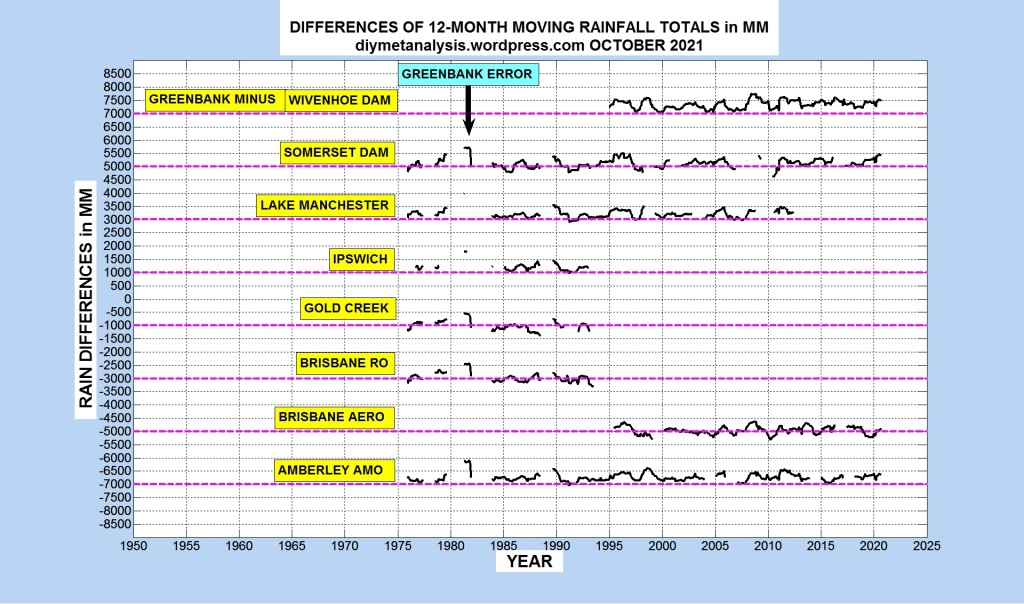
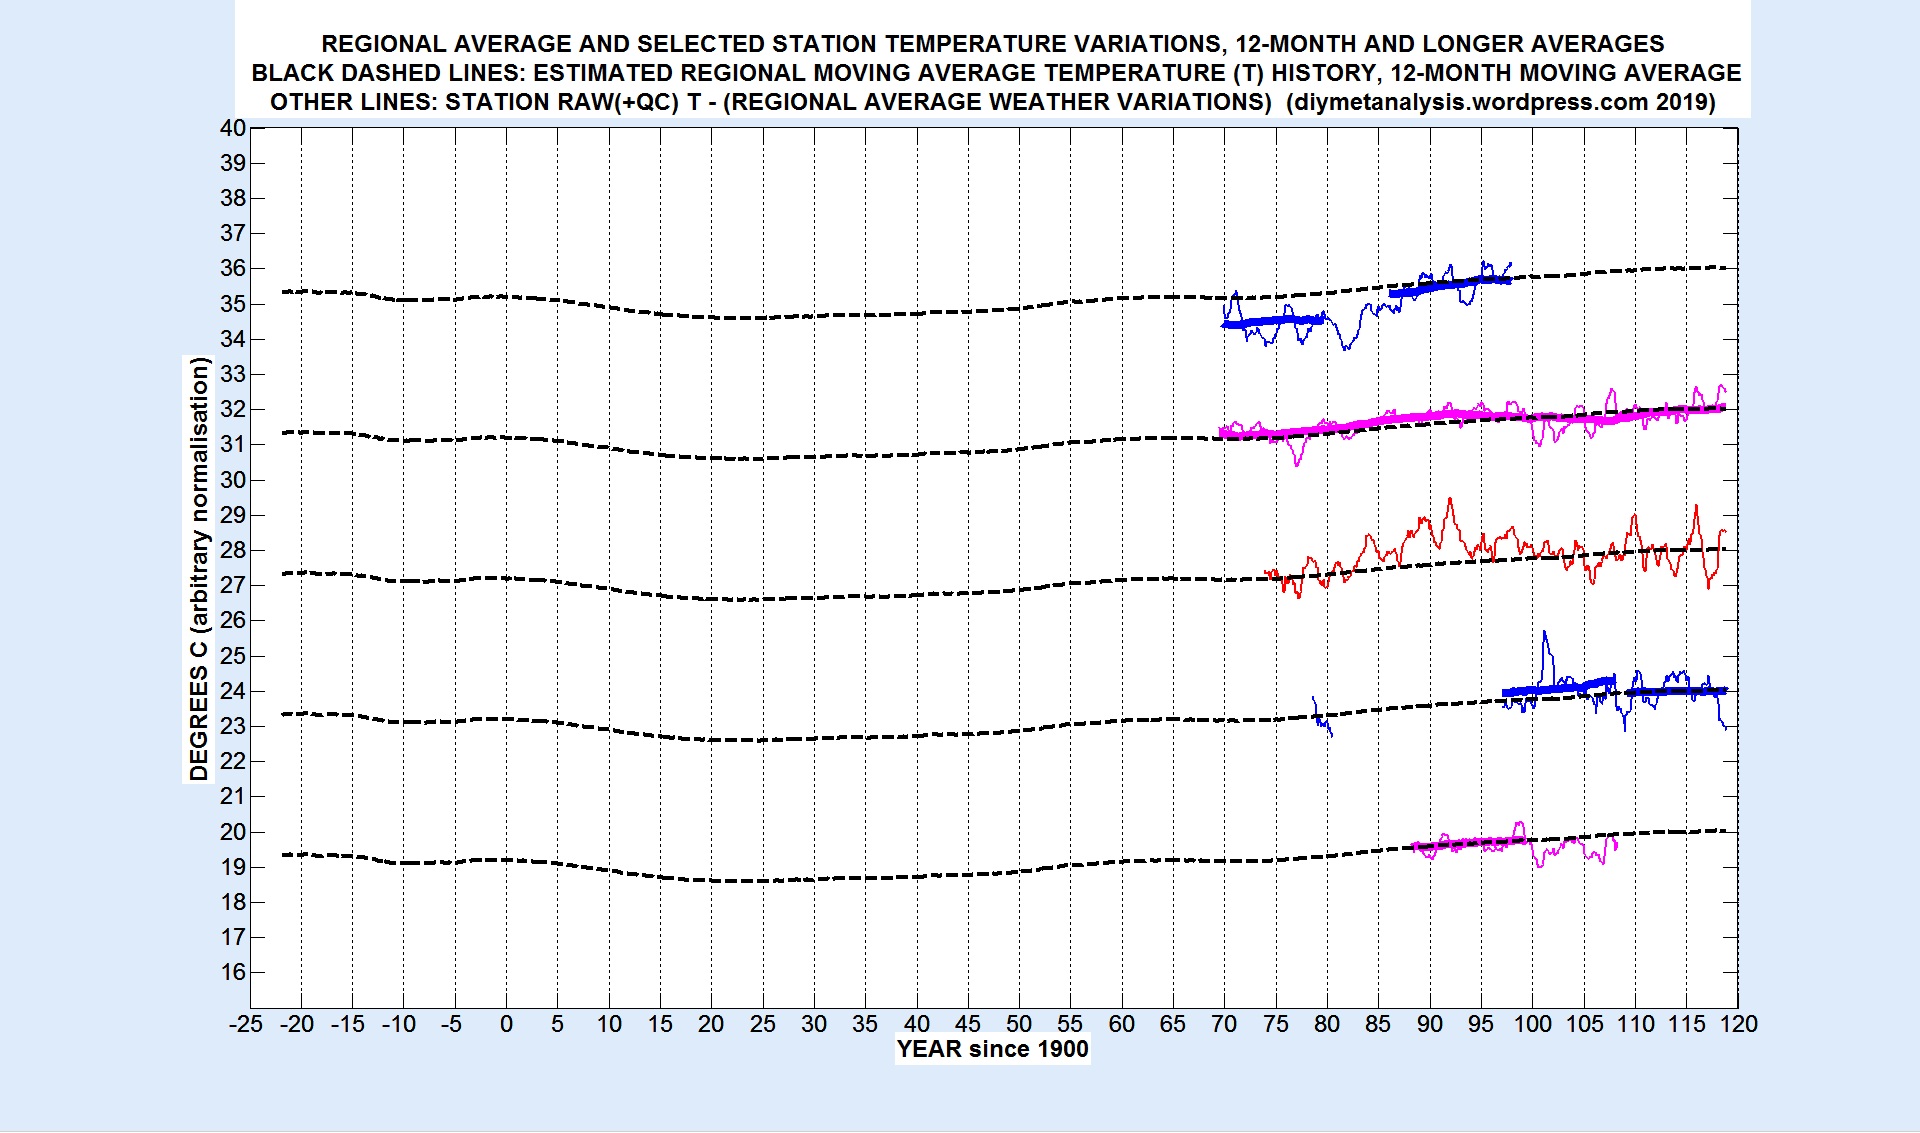
MERGE SCALING

The following figure shows the differences between the composite records in the overlap period used to establish the scaling factor of 1.1 applied to the Yan Yean data:

YAN YEAN ERRORS

The following figure shows daily rainfall totals for Yan Yean from the BoM Climate Data Online website for 2020:

The figure above illustrates twin problems with the data: many days are missing, but at the same time there are figures (possibly invalid) for monthly totals. It is possible that the missing days of data had negligible rainfall. The following extract from the CSV file for daily data suggests that the figures given following gaps in the data are NOT multi-day accumulations:

IDCJAC0009,86131,2020,01,01,0.0,1,N
IDCJAC0009,86131,2020,01,02,0.0,1,N
IDCJAC0009,86131,2020,01,03,,,
IDCJAC0009,86131,2020,01,04,,,
IDCJAC0009,86131,2020,01,05,,,
IDCJAC0009,86131,2020,01,06,14.2,1,N
IDCJAC0009,86131,2020,01,07,1.4,1,N
IDCJAC0009,86131,2020,01,08,,,
IDCJAC0009,86131,2020,01,09,,,
IDCJAC0009,86131,2020,01,10,,,
IDCJAC0009,86131,2020,01,11,18.8,1,N
IDCJAC0009,86131,2020,01,12,,,
IDCJAC0009,86131,2020,01,13,,,
IDCJAC0009,86131,2020,01,14,,,
IDCJAC0009,86131,2020,01,15,,,
IDCJAC0009,86131,2020,01,16,30.2,1,N
IDCJAC0009,86131,2020,01,17,,,
IDCJAC0009,86131,2020,01,18,,,
IDCJAC0009,86131,2020,01,19,0.0,1,N
IDCJAC0009,86131,2020,01,20,3.2,1,N
IDCJAC0009,86131,2020,01,21,,,
IDCJAC0009,86131,2020,01,22,,,
IDCJAC0009,86131,2020,01,23,16.0,1,N
IDCJAC0009,86131,2020,01,24,3.0,1,N
IDCJAC0009,86131,2020,01,25,0.0,1,N
IDCJAC0009,86131,2020,01,26,,,
IDCJAC0009,86131,2020,01,27,0.0,1,N
IDCJAC0009,86131,2020,01,28,0.0,1,N
IDCJAC0009,86131,2020,01,29,0.0,1,N
IDCJAC0009,86131,2020,01,30,,,
IDCJAC0009,86131,2020,01,31,,,

The second to last entry in the data extract above is the number of days of accumulation.

STATIONS USED

The stations used in the analysis are shown below, a direct copy and paste from the MATLAB software. The flags after the BoM id control which stations are used for the early and late homogeneity plots.

stations = […
% BoM id
01 86131 1 1 1855 2021;… % Yan_Yean_rain
02 86071 1 0 1855 2015;… % Melbourne_regional_office
03 86035 1 1 1906 2021;… % Eltham_rain
04 86036 1 1 1906 2021;… % Epping_rain
05 86138 1 0 1888 1939;… % Greenborough_rain
06 86110 1 0 1940 1972;… % Morang_rain
07 86117 1 1 1892 2021;… % Toorourrong_Res_rain
08 86122 1 0 1937 1973;… % Watsonia_rain
09 86125 1 1 1902 2003;… % Whittlesea_rain
10 86282 0 1 1970 2021;… % Melbourne_Airport_rain
11 86038 1 0 1929 1986;… % Essendon_Airport_rain
12 86305 0 1 1972 2021;… % Greenvale_Reservoir_rain
13 88060 0 0 1884 2021;… % Kinglake_West_rain
14 86374 0 0 1989 2021;… % Kinglake_West_rain
15 86096 1 1 1910 2021;… % Preston_Reservoir_rain
16 86377 0 1 1986 2021;… % Upper_Plenty_rain
17 86068 0 1 1999 2021;… % Viewbank_rain
18 86350 0 1 1979 2021;… % Wallan_rain
19 88162 0 1 1994 2021;… % Wallan_Kilmore_rain
20 87031 0 1 1941 2021]; % Laverton_RAAF_rain
%

END OF POST

Example 10: BRISBANE Rainfall

Author: Dr Michael Chase (October 2021)

Source of the figure above: Govt of Queensland/BoM

This article shows a composite monthly rainfall record for the city of Brisbane in Queensland. First of all a short summary of the “Missing Rainfall Data Problem”, which has had an impact on the selection of the records used in the composite.

Missing Rainfall Data Problem

Part of the problem of missing rainfall data is illustrated in the following figure for the Brisbane area, showing how recent decades have many months of missing monthly total data, months with missing totals are indicated with vertical ticks:

Missing months of data for 33 Brisbane area weather stations

A further part of the problem is that some of the monthly rainfall totals that are present are INVALID, they are derived by assuming that missing days of rainfall data had no rain. For example, the lowest line in the figure above is for the station Amberley AMO, which has 4 months of missing monthly totals. A plot of the monthly totals of missing DAYS shows that more than 4 months should be missing:

The following figure shows an example month where rain fell on a missing day, hence the monthly total is biased low:

Finally, another part of the problem lies with GHCNM, which no longer has updates for rainfall data. GHCND still has daily rainfall data in some of its currently reporting stations, but many of those daily totals are missing, and in most areas the density of currently reporting stations is too low for reliable infilling.

BRISBANE COMPOSITE RAINFALL

Two overlapping station monthly records were chosen, checked for quality and homogeneity, and scaled so as to create a composite covering as many years as possible. The expectation was that the recent data would come from Amberley AMO, a meteorological office relatively close to the site of the longest historical record of Brisbane Regional Office. However, it was found that the Amberley AMO data is too unreliable in recent years. The recent years of the composite record comes from the station Greenbank Thompson Road.

The following figure shows 12-month moving rainfall totals, and the differences in the overlap period:

Note that the latest data has been scaled up by 10% to avoid an inhomogeneity, and that there is a steep gradient in rainfall in the Brisbane area (see the first figure above).

Quality and Homogeneity

The following figure shows differences of 12-month moving rainfall totals between Brisbane RO and other long historical records in the area:

The figure above indicates an inhomogeneity in the Toowoomba data, but nothing significant for Brisbane RO. Note in particular the consistency with nearby Gold Creek Reservoir.

The following figure shows differences of 12-month moving rainfall totals between Greenbank Thompson Road and other recent records in the area:

The only substantial problem with the Greenbank data is with a few abnormally high monthly totals in 1981, which are set to NaN (i.e. missing).

Quality control plots for individual months were examined, but are not shown.

The full list of station data examined is as follows, a direct copy and paste from the software:

stations = […
% BoM id
01 40004 1 1 1941 2021;… % Amberly_AMO
02 40816 1 1 2000 2021;… % Amberly_dnrm
03 41003 1 1 1877 2001;… % Balgownie_West
04 40842 1 1 1994 2021;… % Brisbane_Aero
05 40215 1 1 1890 1984;… % Brisbane_Bot_Gardens
06 40214 1 1 1840 1994;… % Brisbane_RO
07 41011 1 1 1887 2014;… % Cambooya_PO
08 41512 1 1 1990 2021;… % Cooby_Creek_Dam
09 40808 1 1 1990 2021;… % Cressbrook_Dam
10 41024 1 1 1906 2021;… % Doctors_Creek
11 40230 1 1 1885 1994;… % Gold_Creek_Reservoir
12 40659 1 1 1975 2021;… % Greenbank_Thompson
13 40094 1 1 1896 2021;… % Harrisville_PO
14 40101 1 1 1870 1994;… % Ipswich
15 40104 1 1 1887 2021;… % Kalbar_School
16 40114 1 1 1889 1993;… % Laidley_PO
17 40115 1 1 1917 2013;… % Lake_Manchester
18 40517 1 1 1953 2021;… % McKenzie_Creek
19 40140 1 1 1890 2021;… % Mt_Brisbane
20 40142 1 1 1894 2011;… % Mt_Crosby
21 40197 1 1 1888 2021;… % Mt_Tamborine
22 40152 1 1 1909 2013;… % Murgon_PO
23 41082 1 1 1886 2021;… % Pittsworth_PO
24 40184 1 1 1894 2021;… % Rosewood_Walloon
25 40186 1 1 1919 2018;… % Samsonvale
26 40189 1 1 1936 2021;… % Somerset_Dam
27 40244 1 1 1888 2018;… % Sunnybank
28 40245 1 1 1889 2001;… % Toowong_Bowl
29 41103 1 1 1869 2007;… % Toowoomba
30 40082 1 1 1897 2021;… % U_of_Q_Gatton
31 41013 1 1 1879 2021;… % Warwick_Canning
32 41044 1 1 1898 2001;… % Warwick_Hermitage
33 40763 1 1 1995 2021]; % Wivenhoe_Dam

END OF POST

AUSTRALIA-NZ Tmax

Author: Dr Michael Chase

australia-states-map-v3

INTRODUCTION

This article shows reconstructions of how daily maximum surface air temperature (Tmax) has varied since the mid to late 19th century in Australia and New Zealand. Results have been obtained for each of the 12 separate monthly averages, but only 12-month moving averages are shown here.

The reconstruction of changes in surface air temperature from instrumental data is an interesting and important problem. In Australia and New Zealand many diligent observers have produced a high density of quality data, and researchers there have digitised much of this data, and have produced summaries of documented changes in the weather stations. We must also thank the Australian BoM and the New Zealand NIWA for making the data freely and easily available to the public.

Some people believe that temperature reconstruction is partly or wholly impossible or unreliable, because of issues such as urban heating and non-standard thermometer enclosures or siting. Those issues can be difficult to deal with, but primarily only when they change. It is CHANGE in the measurement system or its environment that can lead to errors in temperature reconstruction. The methodology used to suppress errors caused by such changes is as follows.

Typically around 40 RAW monthly average temperature records in a region are decomposed, separately for each month, into a moving average (MAV) time series, typically of 13 or 15 consecutive years, and a series of deviations from the MAV series. The deviations are averaged across stations to obtain their regional average. The regional average deviations are subtracted from each station’s raw temperature data, reducing the size of the “noise” caused by the always fluctuating weather. The resulting weather-corrected data are moving-averaged again, and a regional moving average obtained as follows: separately for each month, the year-to-year MAV temperature changes are averaged democratically across stations, and those average temperature changes are simply integrated forwards and backwards in time from an arbitrary reference year, 2015 in the examples shown in this article.

The processing described above gives results that are distorted by non-climatic perturbations, such as those that result from station moves, equipment changes, and sudden or gradual changes in the local thermal environment. This distortion is removed simply by excluding the periods of data deemed to be suffering from time-varying non-climatic influences. Such periods are detected visually (i.e. not automatically), by comparing station data with the latest version of the regional average, which is recomputed after each period of perturbed data is marked for exclusion.

Details of the reconstruction algorithms and procedure can be found in the pages above, starting with OUTLINE.

Results for 6 large areas of Australia, plus New Zealand, are presented below. The moving average plots are all presented together, to facilitate comparisons, followed by the complete set of temperature deviations from the moving averages. The post ends with a sample station analysis, for the town of Boulia in inland Queensland.

NORTH AUSTRALIA

The following figure shows the moving averages of Tmax variations for the following regions in the North of Australia:

  • Port Hedland (Onslow to Broome, inland to Newman, Nullagine, Wittenoom)
  • Darwin (Broome to Burketown, inland to Halls Creek, Victoria River Downs)
  • North-West Queensland (Camooweal-Burketown-Hughenden-Barcaldine-Birdsville)

MAV_PLOT_NORTH

Note the similarity of the temperature variations, and the East-West trend in the size of the overall change in temperature, greatest in the West, least in the East.

WEST AUSTRALIA

The following figure shows the moving averages from the following regions in the West of Australia:

  • Port Hedland (as above)
  • Kalgoorlie – Merredin – Cue – Meekatharra – Wiluna
  • Perth (Albany to Geraldton, inland to York, Northam, Dalwallinu, Morawa)

MAV_PLOT_WEST

Note the similarity between Perth and Kalgoorlie in the South, and that they differ in shape from Port Hedland in the North, but with a similar overall change in temperature.

EAST AUSTRALIA

The following figure shows the moving averages from the following regions in the East of Australia:

  • Cairns (Cooktown to Mackay, inland to Palmerville, Charters Towers)
  • Brisbane (Rockhampton to Yamba)
  • Sydney (Newcastle to Moruya Heads)

MAV_PLOT_EAST

Note the similarity of the plot above with the previous one for the West, suggesting a consistent difference in shape between North and South.

CENTRAL-EAST AUSTRALIA

The following figure shows the moving averages from the following regions in Australia:

  • Northern Territory (Alice Springs, Tennant Creek, Barrow Creek, plus near neighbours in WA, QLD, NSW, SA).
  • QLD South (Thargomindah, Longreach, Emerald, Miles, Goondiwindi)
  • NSW North East (Wilcannia, Bourke, Walgett, Goondiwindi, Dubbo)
  • SA/NSW border (Woomera, Oodnadatta, Tibooburra, Ivanhoe, Mildura)

MAV_PLOT_CENTRE

Note the temporary dips in temperature around 1950/60 in QLD-SOUTH and NSW-NE, possibly related to relatively high rainfall in those areas in that period.

ADELAIDE and INLAND VICTORIA/NSW BORDER

The following figure shows the moving averages from the following regions in South-East Australia:

  • Adelaide (Port Lincoln, Adelaide area, Cape Borda)
  • Inland Victoria/NSW border (Swan Hill, Hay, Wagga Wagga, Albury, Boort)

MAV_PLOT_ADEL

SOUTH-EAST AUSTRALIA and NEW ZEALAND

The following figure shows the moving averages from the following regions in Southern Australia and New Zealand:

  • Melbourne (plus Cape Otway, Wilsons Prom, Sale)
  • Tasmania (the whole island)
  • New Zealand (excluding the far North and South)

MAV_PLOT_SOUTH

Note the strong similarity between Melbourne and Tasmania, both of which have the mid 20th century dips seen in the previous examples further North.

TEMPERATURE DEVIATIONS

The following set of plots show the associated temperature deviations, as 12-month moving averages, from the moving averages shown above. In some cases early peaks, when added to the moving average, give temperatures similar to those of recent years, but note the statistical fact that there is more data to choose from in the early “cool” years, compared with the recent “warm” years.

DEVN_PLOT_NORTH

DEVN_PLOT_WEST

DEVN_PLOT_EAST

DEVN_PLOT_CENTRE

DEVN_PLOT_ADEL

DEVN_PLOT_SOUTH

SAMPLE STATION ANALYSIS

The following plot shows some of the analysis performed for one temperature record, from the town of Boulia in inland Queensland. The QLD-NORTH temperature deviations shown above were subtracted from various versions of the data for Boulia.

BOULIA_PLOT_NORTH

The raw data in red maintains close alignment with the regional average, apart from an anomalous warm period around 1914, probably due to a broken screen, and an anomalous cool period starting around 1980, probably caused by the onset of watering of the lawn on which the thermometers were sited, and ending in 1999 when the station moved to the airport. The metadata for these changes can be found in TOROK-1997 and ACORN-SAT documentation, see the DATA page above for links.

Berkeley Earth (BEST) (2013) data in blue for nearby Mount Isa maintains close alignment with the regional average throughout. GHCNMv3-adjusted appears to have been fooled by a transient warming around 1940. That 1940 transient was correctly ignored by ACORN-SATv2, but it appears that the onset of lawn watering around 1980 is badly over-corrected in that version of events, leading to over-cooling of early data by around 1C.

END OF POST


ACORN-SATv2 TEST04: CARPENTARIA

Author: Dr Michael Chase, December 2019

Acorn-sat_map_Bom-CARP

Map above: The ACORN-SATv2 stations featured in this post

SCOPE

This post documents ACORN-SATv2 validation test results for the Gulf of Carpentaria coast of Queensland, featuring the following stations, with BoM ids in brackets:

  • BURKETOWN (29077)
  • NORMANTON (29063)
  • WEIPA (27045)
  • HORN ISLAND (27058)

See the ACORN-SAT page above for information about the data being tested, and the test procedure.

See the BEST page above for information about Berkeley Earth, the data used here as a “reference series”, in this region for the following location: 15.27 S, 142.50 E.

ACORN-SATv2 versus BEST, Tmax

The following figure shows ACORN – BEST, as a 12-month moving average, normalised to zero for recent years:

Fig92_Tmax

The figure above suggests that ACORN-SATv2 is anomalously cool in the early to mid 20th century for Burketown and Normanton. Analysis plots for these stations may be added for these stations at a later date.

ACORN-SATv2 versus BEST, Tmin

The following figure shows ACORN – BEST, as a 12-month moving average, normalised to zero for recent years:

Fig92_Tmin

The figure above suggests that ACORN-SATv2 data for Horn Island is anomalously cool throughout the 20th century, the reason for this is identified in the following analysis plot.

Analysis of Horn Island Tmin

The following figure shows 12-month moving averages of differences between monthly data as follows:

  • Blue: (RAW – ACORN). This indicates the adjustments made in ACORN-SATv2
  • Red: (RAW – BEST). This indicates the variation of non-climatic influences

Fig80_Horn_Island_Tmin

The ACORN-SATv2 error is the difference between the blue and red curves, the positive difference before 1992 indicating excessive cooling of raw data. The red data in the figure above shows that no adjustment (at the level of annual averages) is necessary between 1970 and 2005.

Preliminary analysis suggests that the ACORN-SATv2 error in 1992 arose from the very small number (2) of reference stations used to derive the size of it, one of which has anomalous temperature changes around 1992. This post may be updated later with more details.

End of Post


ACORN-SATv2 TEST03: TASMANIA

Author: Dr Michael Chase, December 2019

australia-states-map

This posts documents validation test results for ACORN-SATv2 stations in Tasmania, for both Tmax and Tmin. The stations and their BoM ids are as follows:

  • LOW HEAD (91293)
  • LAUNCESTON AIRPORT (91311)
  • LARAPUNA (92045)
  • CAPE BRUNY (94010)
  • HOBART (94029)
  • GROVE (94220)
  • BUTLERS GORGE (96003)

Background information for ACORN-SAT, and for the validation procedure, can be found via the ACORN-SAT page above, which also gives details of how the daily data was converted to monthly averages.

Berkeley-Earth (BEST) data for the country of Tasmania was used as a “reference series”, see the BEST page above for links to the data, and a discussion of how well it is suited to this purpose.

ACORN-SATv2 versus BEST, Tmax

The following figure shows, for each station listed above, for Tmax data, 12-month moving averages of (ACORN – BEST), normalised to zero for recent years:

Fig92_TAS_Tmax

Some of the ACORN-SAT Tmax station data does not have trend consistency between stations, see in particular the difference between Grove and Butlers Gorge, it therefore fails at least this part of the validation procedure. Analysis may be added later to this post to identify the adjustments that are invalid.

ACORN-SATv2 versus BEST, Tmin

The following figure shows, for each station listed above, for Tmin data, 12-month moving averages of (ACORN – BEST), normalised to zero for recent years:

Fig92_TAS_Tmin

Some of the ACORN-SAT Tmin station data does not have trend consistency between stations, see in particular the difference between Butlers Gorge and Cape Bruny, it therefore fails at least this part of the validation procedure. Analysis may be added later to this post to identify the adjustments that are invalid.

End of Post (more analysis detail may be added later)

ACORN-SATv2 TEST02: ADELAIDE

Author: Dr Michael Chase, November 2019

australia-states-map

SCOPE

This post gives validation test results for ACORN-SATv2 stations in the vicinity of Adelaide, which are as follows, with BoM ids:

  • Adelaide Kent Town (23090)
  • Snowtown (21133)
  • Nuriootpa (23373)
  • Cape Borda (22823)

See the ACORN-SAT page above for background information, details of the validations tests, and an outline of how they were done.

Both Tmax and Tmin results are obtained by using Berkeley Earth BEST (2013) data for the city of Adelaide, acting as “reference series”. See the BEST page above for the reasoning behind this choice of reference series. Note that there is currently no independent validation of the BEST data for Adelaide.

ACORN-SATv2 vs BEST

The following two figures (Tmax and Tmin) act as surveillance test results, indicating stations with significant errors. Plotting the stations together allows checking of the internal self consistency of ACORN-SAT, these stations are close together, at a similar distance from the ocean, so should have very similar climatologies.

The following figures show 12-month moving averages of ACORN – BEST:

Fig91_Tmax

Fig91_Tmin

The only substantial error is in ACORN-SATv2 Snowtown Tmax, which is over-cooled in early years, and is inconsistent with its neighbours.

SNOWTOWN Tmax Analysis

The following figure allows us to compare ACORN-SATv2 adjustments (blue) with changes in raw data (red):

ACS_TEST_SNOWTOWN_Tmax

The figure above indicates that the raw data doesn’t really need any overall end-to-end adjustment. The spurious ACORN-SATv2 adjustments appear to arise from the tunnel-vision of the procedure, mistaking transient changes for persistent ones.

End of Post


ACORN-SATv2 TEST01: ALBURY Tmin

Author: Dr Michael Chase, November 2019

australia-states-map-ALBURY

SCOPE

This post gives validation test results for ACORN-SATv2 monthly average minimum temperatures (Tmin) at the stations near Albury, which in order of presentation, with BoM ids, are:

  • Deniliquin (74258)
  • Rutherglen (82039)
  • Wagga Wagga (72150)
  • Kerang (80023)

METHODOLOGY

Berkeley Earth (BEST) Tmin data for the nearby town of Albury are used as a “reference series” to test for inhomogeneities, consistency between near neighbours, and validity of the station adjustments relative to changes in the raw data. See the BEST page above for a discussion of the validity of BEST data as a reference series, both in general, and for the specific case of Albury.

DENILIQUIN

The following figure shows the validity of the best of this cluster of stations:

ACSAT_TEST_ALBURY_01_V2


The blue data show the size of the adjustments made to raw data, plotted so as to indicate how ACORN-SAT has decided the raw data (in red) has changed as a result of non-climatic influences. The figure above shows that the ACORN-SAT “rectangular” model of non-climatic influences works well for this example. A later plot shows very close agreement between ACORN-SATv2 (Deniliquin) and BEST (Albury) Tmin data.

RUTHERGLEN

The following figure reveals an error in ACORN-SATv2 for Rutherglen, the onset of a transient temperature change around 1967 was not detected, leading to excessive cooling of all data before the perturbation (see a later figure for the size of the excessive cooling):

ACSAT_TEST_ALBURY_02

WAGGA WAGGA

The following figure reveals two errors in ACORN-SATv2 for Wagga Wagga, leading to excessive cooling of most 20th century temperatures (see a later figure for the size of the excessive cooling):

ACSAT_TEST_ALBURY_03

KERANG

The following figure reveals an errors in ACORN-SATv2 for Kerang, leading to excessive cooling of early data (see a later figure for the size of the excessive cooling):

ACSAT_TEST_ALBURY_04

ERROR SUMMARY

Apart from the case of Deniliquin, ACORN-SATv2 Tmin adjustments in this region have been found to lead to excessive cooling of the past, from a combination of missed adjustments, erroneous adjustments and slow drifts away from the “rectangular” assumption for temperature changes. The following figure summarises the errors:

ACSAT_TEST_ALBURY_05_V2


VALIDITY OF BEST ALBURY Tmin

The following figure shows a comparison between BEST Albury Tmin data and the regional average of this website, as posted in EXAMPLE 02: Rutherglen Tmin:

ACSAT_TEST_ALBURY_06

There is a discrepancy around 1910, which should not impact on the test results for ACORN-SAT.

End of Post


Example 09: Central Australia Tmax

Author: Dr Michael Chase, November 2019

australia-states-map-ALICE

This post gives a reconstruction of monthly average maximum temperatures (Tmax) back to 1878 in the central part of Australia, roughly centred on the town of Alice Springs, which has the oldest data in the region, and shown as the red rectangle on the above map. In addition, data from Darwin Post Office was used to help with the early period.

Methodology: The standard methodology of this website was used. Data was averaged democratically across the region, with exclusion of periods deemed to be invalid due to non-climatic influences, such as station moves and equipment changes.

Data Sources: All temperature data was downloaded from the BoM Climate Data Online website, in November 2019 for the stations that are still active. Metadata sources used were TOROK (1997) and the ACORN-SATv2 online station catalogue, see the DATA PAGE above for links.

RESULTS

The following figure shows the 12-month moving averages of the regional moving average (MAV, the dashed line) and the sum of MAV and the regional average temperature deviations from the MAV.

Fig104

The seasonal variations of Tmax are shown in the following figure:

Fig101

VALIDATION

The following set of figures show ALL the data examined, including the periods and stations selected for exclusion, in order of increasing start date. The first few figures are most important, as they cover the difficult early period when there is little or no error suppression from averaging over many stations. Validation at the level of 12-month averages follows from the large amount of data that is approximately parallel to the regional moving average. Similar plots, not shown in this example, were examined for individual months. Station names, start dates, and indices in the alphabetical list of stations at the end of the post, from top to bottom on the plots, are given below each figure.

Fig50

1 03 1878 ALICE SPRINGS PO
2 24 1882 DARWIN PO
3 11 1888 BOULIA AIRPORT
4 19 1888 CLONCURRY Mc
5 33 1889 MARREE FARINA

Fig51

06 14 1890 BURKETOWN PO
07 16 1893 CHARLOTTE WATERS
08 30 1898 OLD HALLS CREEK
09 15 1907 CAMOOWEAL
10 40 1910 TENNANT CREEK PO

Fig52

11 26 1938 ERNABELLA
12 27 1938 FINKE PO
13 18 1939 CLONCURRY AERO
14 31 1940 OODNADATTA
15 02 1941 ALICE SPRINGS AIRPORT

Fig53

16 23 1941 DARWIN AIRPORT
17 29 1944 HALLS CREEK
18 07 1945 BARROW CREEK
19 06 1950 BALGO HILLS
20 10 1954 BIRDSVILLE POLICE

Fig54

21 28 1956 GILES MO
22 12 1957 BRUNETTE DOWNS
23 35 1957 MOUNT ISA PO
24 20 1965 COOBER PEDY
25 22 1965 CURTIN SPRINGS

Fig55

26 36 1965 MOUNT ISA MINE
27 41 1965 VICTORIA RIVER DOWNS
28 34 1966 MOUNT ISA AERO
29 05 1967 AYERS ROCK
30 32 1967 JERVOIS

Fig56

31 38 1969 RABBIT FLAT 1
32 39 1969 TENNANT CREEK AIRPORT
33 43 1973 WAVE HILL
34 17 1978 CLONCURRY AIRPORT
35 01 1988 ALI CURUNG

Fig57

36 21 1994 COOBER PEDY AIRPORT
37 37 1996 RABBIT FLAT 2
38 25 1997 ERNABELLA PUKATJA
39 08 1998 BEDOURIE
40 04 2000 ARLTUNGA

Fig58

41 09 2000 BIRDSVILLE AIRPORT
42 13 2001 BURKETOWN AIRPORT
43 42 2001 WALUNGURRU

STATION DATA

The nominal number of stations used for each year is shown in the following figure, the actual number of stations is generally a bit lower because some periods of data are excluded from regional averaging.

Fig01

The full list of stations, with their BoM ids, and the parameters that can vary from region to region, are given below, this acts as the configuration information for this version of the regional average, together with the “transition” periods indicated in the validation figures shown above.

%
N_half = 7; % NOMINAL MAV window size = 2*N_half + 1
Max_gap = 5; % Maximum gap size (years) that is in-filled
%
stations = […
%id1 id2 D A From Norm To D/A are Weather/Moving-average flags, see NOTES
01 15502 1 1 1988 1999 2014;… % ALI CURUNG
02 15590 1 1 1941 2018 2019;… % ALICE SPRINGS AIRPORT
03 15540 1 1 1878 1929 1953;… % ALICE SPRINGS PO
04 15594 1 1 2000 2018 2019;… % ARLTUNGA
05 15527 1 0 1967 1982 1983;… % AYERS ROCK
06 13007 1 1 1950 2015 2016;… % BALGO HILLS
07 15525 1 1 1945 1987 1988;… % BARROW CREEK
08 38000 1 1 1998 2018 2019;… % BEDOURIE
09 38026 1 1 2000 2018 2019;… % BIRDSVILLE AIRPORT
10 38002 1 1 1954 1987 2005;… % BIRDSVILLE POLICE
11 38003 1 1 1888 2016 2019;… % BOULIA AIRPORT
12 15085 1 0 1957 2016 2019;… % BRUNETTE DOWNS
13 29077 0 0 2001 2016 2019;… % BURKETOWN AIRPORT
14 29004 1 1 1890 1920 2009;… % BURKETOWN PO
15 37010 1 1 1907 2015 2019;… % CAMOOWEAL
16 15597 1 1 1893 1937 1938;… % CHARLOTTE WATERS
17 29141 1 1 1978 2016 2019;… % CLONCURRY AIRPORT (From 1998)
18 29009 1 1 1939 1974 1975;… % CLONCURRY AERO
19 29008 1 1 1888 1951 1952;… % CLONCURRY Mc
20 16007 1 0 1965 1993 1994;… % COOBER PEDY
21 16090 1 0 1994 2018 2019;… % COOBER PEDY AIRPORT
22 15511 1 1 1965 2016 2019;… % CURTIN SPRINGS
23 14015 0 0 1941 2016 2019;… % DARWIN AIRPORT
24 14016 1 1 1882 1929 1935;… % DARWIN PO **** 1935-42 TRANSITION
25 16097 1 1 1997 2016 2019;… % ERNABELLA PUKATJA
26 16013 1 1 1938 1982 1983;… % ERNABELLA
27 15526 1 0 1938 1979 1980;… % FINKE PO
28 13017 1 1 1956 2016 2019;… % GILES MO
29 02012 1 1 1944 2016 2018;… % HALLS CREEK
30 02011 1 1 1898 1951 1969;… % OLD HALLS CREEK **** 1953-62 MOSTLY NaNs
31 17043 1 1 1940 2016 2019;… % OODNADATTA
32 15602 1 1 1967 2016 2019;… % JERVOIS
33 17024 1 1 1889 1908 1939;… % MARREE FARINA
34 29127 1 1 1966 2016 2019;… % MOUNT ISA AERO (From 1967)
35 29125 1 1 1957 1970 1971;… % MOUNT ISA PO
36 29126 1 1 1965 1991 1992;… % MOUNT ISA MINE
37 15666 1 0 1996 2016 2019;… % RABBIT FLAT 2
38 15548 1 1 1969 1997 1998;… % RABBIT FLAT 1
39 15135 1 1 1969 2016 2019;… % TENNENT CREEK AIRPORT
40 15087 1 1 1910 1957 1970;… % TENNENT CREEK PO
41 14825 1 0 1965 2016 2019;… % VICTORIA RIVER DOWNS
42 15664 1 1 2001 2016 2019;… % WALUNGURRU
43 14840 1 0 1973 2016 2019;… % WAVE HILL

*****************************
% NOTES:
% See also comments in ARRAY_INIT, QC_APP, QC_ADD, TR_APP
% STORE_TEMPERATURE_DATA, STORE_RAIN_DATA
%%%%%%%%%%%%%%%%%%%%%%%%%%%%%
%
% 01. Stations best listed in alphabetical order for ease of manual searching
% 02. For composite groups (e.g. PO and airport) latest is first
% 03. stations matrix, D = 1 means include in regional average Deviations
% 04. stations matrix, A = 1 means include in regional moving Averages
% 05. stations matrix, middle date used for display normalisation
% (no direct effect whatsoever on the outputs)
% 06. QC files allow manual setting of temperatures via QC_APP
% 07. QC files also allow manual temperature shifts via QC_ADD
% 08. QC NaNs are set in station QC files to remove data deemed invalid,
% (especially useful when invalid data occurs near transition boundaries)
% 09. TR files allow manual setting of “transitions” and whether or not
% the transition period contributes to regional-av deviations
% 10. STORE_TEMPERATURE_DATA stores the user-modified temperature data
% 11. STORE_TEMPERATURE_DATA stores transition information (see TR_APP)
% 12. STORE_RAIN_DATA stores rainfall totals
% 13. Transitions can be turned off globally using trans_ON = 0
% 14. Flag = 1 in transitions means EXCLUDE period from regional DEVIATIONS
% 16. Flag = 0 in transitions means INCLUDE in regional DEVIATIONS (used for
% slow transitions, such as gradual UHI and vegetation growth)
%

End of Post

Example 08: PERTH WA Tmax

Author: Dr Michael Chase, October 2019

perth-location-on-the-australia-map

This post documents a reconstruction back to 1897 of monthly average maximum temperatures (Tmax)  in the region of Perth, Western Australia. The standard methodology of this website was used, see the pages above for details. Data and metadata used is specified at the end of the post.

Start Date

Monthly average temperatures for several stations in this region are available from the Australian Bureau of Meteorology (BoM) back to 1880, but there is no data at all for 1884, which prevents the standard methodology of this website from going back before 1885, without additional processing. This additional processing (infilling with “average” data for each month) would have been done, were it not for the fact that the data from 1885 to 1897 is so inconsistent that little confidence could be placed in the resulting temperature history for that period. Thus, the start date is taken to be 1897, the start date of data from Perth Regional Office, which had a Stevenson Screen from that date. The following figure shows the data that has been excluded from 1885 to 1896 (see the first figure in the validation section below for station names):

PERTH_Tmax_Fig50_notrans

RESULTS

The following figure shows the estimated regional-average of the 12-month moving average of daily Tmax:

Perth_Tmax_Fig104

The seasonal and annual average Tmax variations are shown in the following figure:

Perth_Tmax_Fig102

Finally, the Tmax variations for each individual month are shown in the following two figures:

Perth_Tmax_Fig181

Perth_Tmax_Fig182

VALIDATION

The following set of figures show how the data from each station compares with the resulting regional average, the black dashed curve giving its moving average. The station data shown are “weather-corrected” temperatures, in which the regional average temperature fluctuations have been subtracted. The solid lines show the station data periods used in forming the regional average.

PERTH_Tmax_Fig50

PERTH_Tmax_Fig51

PERTH_Tmax_Fig52

PERTH_Tmax_Fig53

PERTH_Tmax_Fig54

PERTH_Tmax_Fig55

PERTH_Tmax_Fig56

PERTH_Tmax_Fig57

Similar plots were also examined for each station showing the variations of monthly average temperature for each month. Examples of these monthly plots are shown in other posts.

APPENDIX

All temperature data was downloaded from the BoM CDO website in September 2019. Metadata sources used were Torok(1997) and ACORN-SAT(2018). See the DATA page for links.

The configuration data for this region were as follows, showing the station data used, any data that were manually removed (QC information), and the “transition” periods implemented (TR information).

N_half = 6; % Moving average window size = 2*N_half + 1
stations = […
01 10244 1 1 1965 1985 1985;… % BAKERS HILL
02 10007 1 1 1949 2019 2019;… % BENCUBBIN
% TR: 1997 05 1997 05 % UNK
03 10515 1 1 1968 2019 2019;… % BEVERLEY
04 09240 1 1 1994 2019 2019;… % BICKLEY
05 09617 1 1 1998 2019 2019;… % BRIDGETOWN
06 09510 1 1 1901 2012 2012;… % BRIDGETOWN COMP
% TR: 1924 12 1944 12]; % COMPLEX DATA PERIOD
07 09514 1 1 1880 1985 1985;… % BUNBURY PO
% QC NaNs: 1949/06 and 1953/12 to 1956/12
% TR: 1880 01 1896 12;… % POOR DATA
% TR: 1922 12 1935 10]; % COMPLEX DATA PERIOD
08 09515 1 1 1900 1975 1975;… % BUSSELTON SHIRE
09 09628 1 1 1901 1975 1975;… % COLLIE
10 10035 1 1 1950 2007 2007;… % CUNDERDIN
11 10286 1 1 1996 2019 2019;… % CUNDERDIN AIRFIELD
12 08039 1 1 1955 2012 2012;… % DALWALLINU COMPARISON
13 08297 1 1 1997 2019 2019;… % DALWALLINU
14 09534 1 1 1902 2019 2019;… % DONNYBROOK
% TR: 1930 01 1930 01;… % UNK
% TR: 1987 10 1987 10]; % MOVE (TOROK)
15 09538 1 1 1935 2019 2019;… % DWELLINGUP
% TR: 1957 01 1957 01;… % UNK
% TR: 1992 12 1992 12]; % UNK
16 09017 1 1 1880 1978 1978;… % FREMANTLE
% TR: 1880 01 1898 12;… % POOR DATA PERIOD
% TR: 1928 10 1928 12]; % UNK (ALSO IN TMIN)
17 08050 1 1 1880 1953 1953;… % GERALDTON TOWN
% TR: 1880 01 1896 12;… % POOR DATA PERIOD
18 08051 1 1 1941 2014 2014;… % GERALDTON AIRPORT COMP
19 08315 1 1 2011 2019 2019;… % GERALDTON AIRPORT
20 09106 1 1 1991 2019 2019;… % GOSNELLS CITY
21 09572 1 1 1900 1950 1985;… % HALLS HEAD
% TR: 1965 01 1985 12]; % POOR DATA PERIOD
22 09172 1 1 1989 2019 2019;… % JANDAKOT AERO
23 09058 1 1 1908 1956 1956;… % KALAMUNDA
24 09111 1 1 1965 2019 2019;… % KARNET
% TR: 1965 01 2002 06]; % POOR DATA PERIOD
25 10073 1 1 1910 2017 2017;… % KELLERBERRIN
% TR: 1910 01 1940 12]; % POOR DATA PERIOD
26 09064 1 0 1955 2012 2012;… % KWINANA BP REFINERY
27 10592 1 0 1956 2012 2012;… % LAKE GRACE
28 09573 1 1 1936 2019 2019;… % MANJIMUP
% TR: 1960 12 1960 12]; % UNK
29 09194 1 1 1983 2018 2018;… % MEDINA RESEARCH CENTRE
30 10093 1 1 1912 1985 1985;… % MERREDIN RESEARCH STATION
31 08093 1 1 1925 2005 2005;… % MORAWA
32 10614 1 1 1913 2019 2019;… % NARROGIN
33 10111 1 1 1902 2017 2017;… % NORTHAM
% TR: 1995 10 1995 10 UNK
34 09021 1 1 1944 2019 2019;… % PERTH AIRPORT
% TR: 1970 11 1970 11 UNK
% TR: 1988 03 1988 03 MOVE (ACORN-SAT CATALOGUE)
% TR: 1997 10 1997 10 MOVE (ACORN-SAT CATALOGUE)
35 09225 1 1 1994 2019 2019;… % PERTH METRO
36 09034 1 1 1897 1962 1992;… % PERTH REGIONAL OFFICE
% TR: 1967 06 1992 12]; % ANOMALOUS WARMING (MOVES/UHI)
37 09053 1 1 1964 2019 2019;… % PEARCE RAAF
38 09038 1 1 1880 1995 1995;… % ROTTNEST LIGHTHOUSE
% TR: 1880 01 1898 12 % POOR DATA
% TR: 1965 01 1965 12 % TRANSIENT PERTURBATION
39 09215 1 0 1993 2019 2019;… % SWANBOURNE
40 08151 1 1 1901 1965 1965;… % WALEBING
% TR: 1915 12 1920 01;… % UNK
% TR: 1946 01 1946 01]; % UNK
41 10648 1 1 1901 2003 2003;… % WANDERING COMPARISON
42 10917 1 1 1998 2019 2019;… % WANDERING
43 08132 1 1 1918 1956 1956;… % WATHEROO
44 08138 1 1 1949 2013 2013;… % WONGAN HILLS RES.STATION
% TR: 1985 01 1985 01 % UNK
% TR: 1995 02 1995 02 % UNK
45 10144 1 1 1880 1996 1996]; % YORK POST OFFICE
% TR: 1880 01 1899 12]; % UNK

End of Post

Example 07: PERTH WA Rainfall

Author: Dr Michael Chase, September 2019

a010-fig2a.image_awa_r7

Update September 2021 Rainfall totals updated up to and including August 2021. Rainfall at Perth has had no obvious long-term trend since around the year 2000, and Perth currently does not feature on the BoM drought map:

20210906.drought1.col

************************************************************

This post gives a reconstruction back to 1876 of monthly totals of rainfall at Perth, Western Australia, effectively an estimate of the rainfall that would have been measured at Perth Airport if the current raingauge had been present at that location back to 1876.

The intention is to put the recent (2019) drought conditions in the area into the longest possible historical perspective. Data from Perth Airport (1944 to present), and nearby Perth Regional (meteorological) Office (1876 to 1992), are tested for inhomogeneities (none are found) and suitably scaled and plotted together to produce a composite record.

Seasonal Results

The following figure shows the seasonal rainfall totals:

PERTH_SEASONAL_RAIN

The data reveal that there has been no discernible change in the frequency of summer (DJF) dry spells, but summer wet spells have become more frequent and wetter.

Autumn (MAM) rainfall totals have declined since around 1990, relative to values before that date. See below for data for individual months.

Winter (JJA) rainfall has been at relatively low levels since around 2000, but are currently at levels similar to those in the late 19th century. There has been no discernible change in spring (SON) rainfall.

Annual Results

The following figure shows 12-month moving (one month at a time) totals of rainfall:

PERTH_12MTH_RAIN_Sept2021

The figure above also shows the difference (black curve) between the two datasets in the overlap period, confirming that the scaling down of the early data by a factor of 0.95 is roughly correct.

Low 12-month totals can be seen in 2000, 2006 and 2010, but at levels similar to many previous dry spells, such as in 1940.

Monthly Results

The following 3 figures show the rainfall totals for individual months (Note: each figure has a different y-axis scale):

PERTH_RAIN_JFMA

PERTH_RAIN_MJJA

PERTH_RAIN_SOND

The low mean of the black differences confirms that 0.95 is a suitable scaling factor for the early data for all months.

It can be seen in the figures above that the main recent decline in rainfall at Perth has been in the relatively wet autumn/winter months of May and June.

VALIDATION

The data shown in the figures above are essentially raw data, so it is necessary to show that they are free from significant inhomogeneities (inconsistencies with neighbouring station data), such as may arise from station relocations or changes in local environment. The method used for inhomogeneity detection is a visual inspection of the differences in rainfall between each station shown and 49 neighbouring stations, some of which have to be relatively distant in order to cover the very early period in the 19th century.

Fortunately the densely populated city of Perth has had a high density of rainfall measuring stations, shown in the following map from the BoM website, allowing considerable confidence that the data shown is free of significant inhomogeneities:

Perth_rain_station_map

The following 2 figures are examples of the station differences examined, the first one for Perth Regional Office, and the second one for Perth Airport. Any inhomogeneity in those datasets would appear as changes in the rainfall differences that are consistent (and persistent) across all stations. An example of an inhomogeneity detected by this method is shown in the previous post on Cape Town rainfall, but nothing has been detected for the Perth data used in this post.

PERTH_RAIN_RO_DIFFS30_v2

PERTH_RAIN_AIRPORT_DIFFS33

Note the smaller differences in rainfall for Perth Airport, due to the neighbours being closer than they are for Regional Office, but note also the worrying feature that more data are missing than a hundred years ago.

Appendix

Some technical issues are explained in this appendix, which ends with details of the station data used.

Some missing early data are infilled using neighbouring data, this allows full use of the existing data in the 12-month moving totals that provide the necessary smoothing for visual inhomogeneity testing. The stations/months infilled are indicated in the station list below.

Differences of station rainfall are computed as difference of LOG10(12-month-moving-totals), reflecting the fact that rainfall totals tend to differ between stations by multiplicative factors rather than the additive offsets assumed for temperature differences. Purely for display purposes the average of all the difference data for a particular station pair is subtracted from each datum, so that the result has zero mean, allowing it to be placed at the desired location on the plots.

Stations used are as follows, the id is the one used by the BoM, which provided all the data for free from their “Climate Data Online” website:

stations = […
% BoMid From To
01 09001  1901 2017;… % ARMADALE
02 09095  1921 1930;… % BAYSWATER
03 09503  1897 2014;… % BOYANUP
04 09514  1877 1985;… % BUNBURY PO
05 09515  1877 2019;… % BUSSELTON SHIRE
06 09516  1914 2002;… % CAPEL
07 09079  1888 1928;… % CLAREMONT
08 09189  1916 1926;… % COTTESLOE BEACH
09 09538  1934 2019;… % DWELLINGUP
10 09702  1915 1945;… % DWELLINGUP RAILWAY
11 09056  1962 2005;… % FLOREAT PARK
12 09257  1986 2019;… % FORRESTDALE
13 09017  1852 1989;… % FREMANTLE (INFILLS 1897 APR–>JULY)
14 09192  1983 2019;… % FREMANTLE OPEN
15 08050  1877 2019;… % GERALDTON
16 09119  1950 1989;… % GNANGARA
17 09106  1961 2019;… % GOSNELLS CITY
18 09020  1928 1990;… % GREENMOUNT
19 09022  1877 1954;… % GUILDFORD
20 09572  1889 2001;… % HALLS HEAD (MANDURAH) 4 INFILLS 1892–>1903
21 09172  1972 2019;… % JANDAKOT AERO
22 09074  1900 1907;… % KALBYAMBA
23 09068  1956 2001;… % MELVILLE
24 09025  1886 2019;… % MIDLAND
25 09012  1958 1981;… % MOUNT YORKINE
26 09035  1940 1974;… % NEDLANDS
27 10111  1877 2019;… % NORTHAM
28 09021  1944 2019;… % PERTH AIRPORT
29 09097  1876 1930;… % PERTH GARDENS
30 09087  1905 1923;… % PERTH HIGHGATE HILL
31 09225  1993 2019;… % PERTH METRO
32 09098  1907 1934;… % PERTH NORTH
33 09034  1876 1992;… % PERTH RO (TIMES 0.95 TO MATCH AIRPORT)
34 09100 1885 1892;… % PERTH STIRLING
35 09036  1897 1995;… % ROCKINGHAM PO
36 09038  1879 1995;… % ROTTNEST LIGHTHOUSE (INFILLS ALL 1893 NaNs)
37 09129  1964 1986;… % SCARBOROUGH BEACH PO
38 09102  1898 1938;… % SUBIACO
39 09151  1967 2019;… % SUBIACO TREATMENT
40 09061  1954 1974;… % SWANBOURNE PO
41 09215  1993 2018;… % SWANBOURNE
42 09216  1968 2018;… % VICTORIA DAM
43 09105  1905 1930;… % WANNEROO EARLY
44 09105  1964 2019;… % WANNEROO LATE
45 09163  1917 2004;… % WEST SWAN
46 09263  2004 2019;… % WHITEMAN PARK
47 09059  1935 1950;… % WINDY RIDGE
48 09045  1934 2000;… % YANCHEP
49 10144  1877 1996]; % YORK PO

End of Post